...
| Name | Description | Screens (Click to view) | ||||
|---|---|---|---|---|---|---|
X-axis Label | X-axis Label |
| ||||
X-axis display as |
| |||||
Y-axis Label | Y-axis Label | |||||
Y-axis Prefix | Y-axis Prefix | |||||
Show Legend? | If checked, the legend will be shown in the generated graph. | |||||
Show Value Label in Chart? | If checked, the value label will be shown in the generated graph. | |||||
Stack Series? | If checked, this will affect the generated graph. | |||||
Display as Horizontal Chart? | Display as Horizontal Chart. | |||||
| Width | Width in character, for example 100%. | |||||
| Height | Height in character, example 300px. | |||||
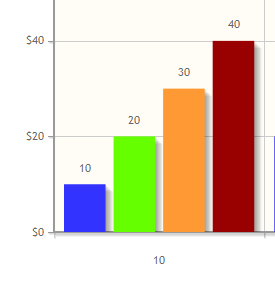
| Colors | Series color. Optional field. Comma-separated values (CSV) of color codes. Example 1: #3333FF,#66FF00,#FF9933,#990000
|
...
Advanced Properties
| Name | Description | Screens (Click to view) | ||||||||||
|---|---|---|---|---|---|---|---|---|---|---|---|---|
Userview Key Name | When defined, the additional conditions will be appended using the value defined here as the parameter and the userview key value as the value.
When userview key value is defined, you may define #userviewKey# in your SQL query to have it replaced with the userview key value.
| Figure 5: Advanced Properties | ||||||||||
Custom Header | Custom Header in HTML. | |||||||||||
Custom Footer | Custom Footer in HTML. |
...
| Note |
|---|
The charts are plotted using jqPlot. Head over to their website here to see the full list of available hooks for customization. |
Hide gridlines from Chart Plot
The following code can be modified and put in "Custom Header" property, to hide gridlines from the chart plot.
| Code Block | ||
|---|---|---|
| ||
<script> $(function(){ $.jqplot.preParseOptionsHooks.push(function(args){ args.axesDefaults.drawMajorGridlines = false; }); }); </script> |
Interactive Chart
The following code can be modified and put in "Custom Footer" for interactive Charts.
...


