...
Chart menu allows you to select a form binder or define your own SQL query to display the chart data for the most common graph types. You can also include charts in your userview Dashboard Menu.
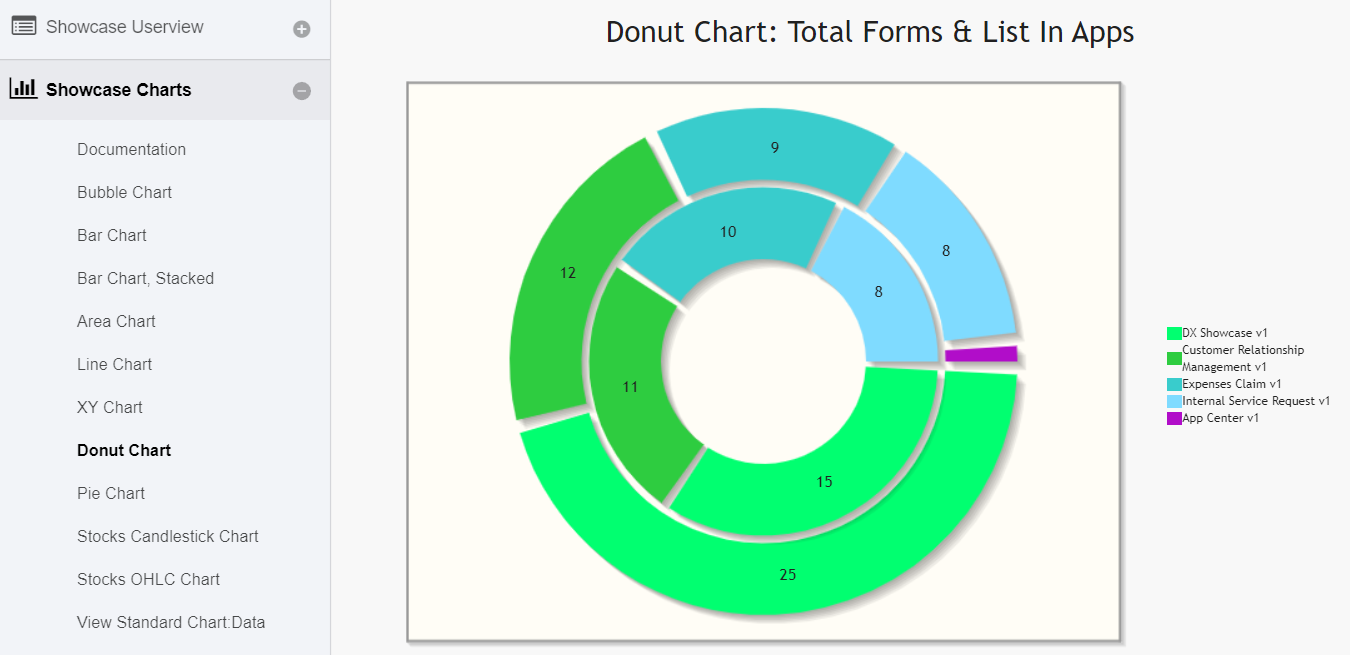
Chart Menu Properties
...
Chart Title: Chart Title to be displayed as part of the generated graph.
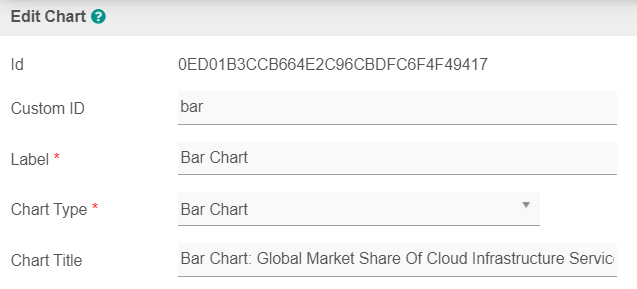
Figure 1: Edit Chart Properties
...
| Code Block | ||||
|---|---|---|---|---|
| ||||
SELECT
    c_status AS 'status',
    COUNT(c_status) AS 'count'
FROM
    app_fd_tix_tickets
WHERE
    c_status IS NOT NULL
GROUP BY
c_status |
Example 2:
| Code Block | ||||
|---|---|---|---|---|
| ||||
SELECT
    c.c_claimant,
    SUM( CAST( replace(c.c_total, '$', '') AS DECIMAL(10, 2)) ) AS 'total',
    AVG( CAST( replace(c.c_total, '$', '') AS DECIMAL(10, 2)) ) AS 'avg'
FROM
    app_fd_j_expense_claim c
GROUP BY
    c.c_claimant
|


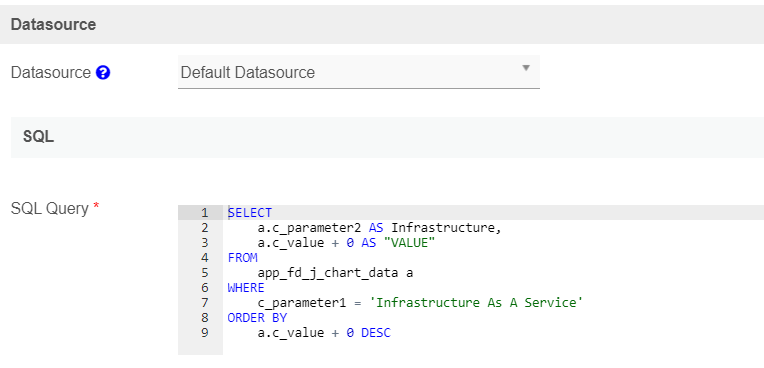
Figure 2: SQL Chart Properties - Datasource
...
Y-axis Values: Y-axis dataset.

Figure 3: Figure 3: Data Binder & Chart Data Mapping Properties
...
Comma-separated values (CSV) of color codes.

Figure 4: Chart Options
Example 1: #3333FF,#66FF00,#FF9933,#990000

Example 2: red,orange,yellow,green,blue,indigo

| Info | ||
|---|---|---|
| ||
http://stackoverflow.com/questions/18332440/what-are-the-jqplot-default-series-colors |
...
Custom Footer: Custom Footer in HTML.

Figure 5: Advanced Properties
...