This is a quick tutorial to show you on how to create a graph using JasperReports iReport Designer.
This tutorial uses the HR Expenses Claim App that comes for free in the bundled by default in Enterprise Edition of Joget, as the example data set.
You This will need to have require iReport Designer in place to be installed in your machine, to design the report.
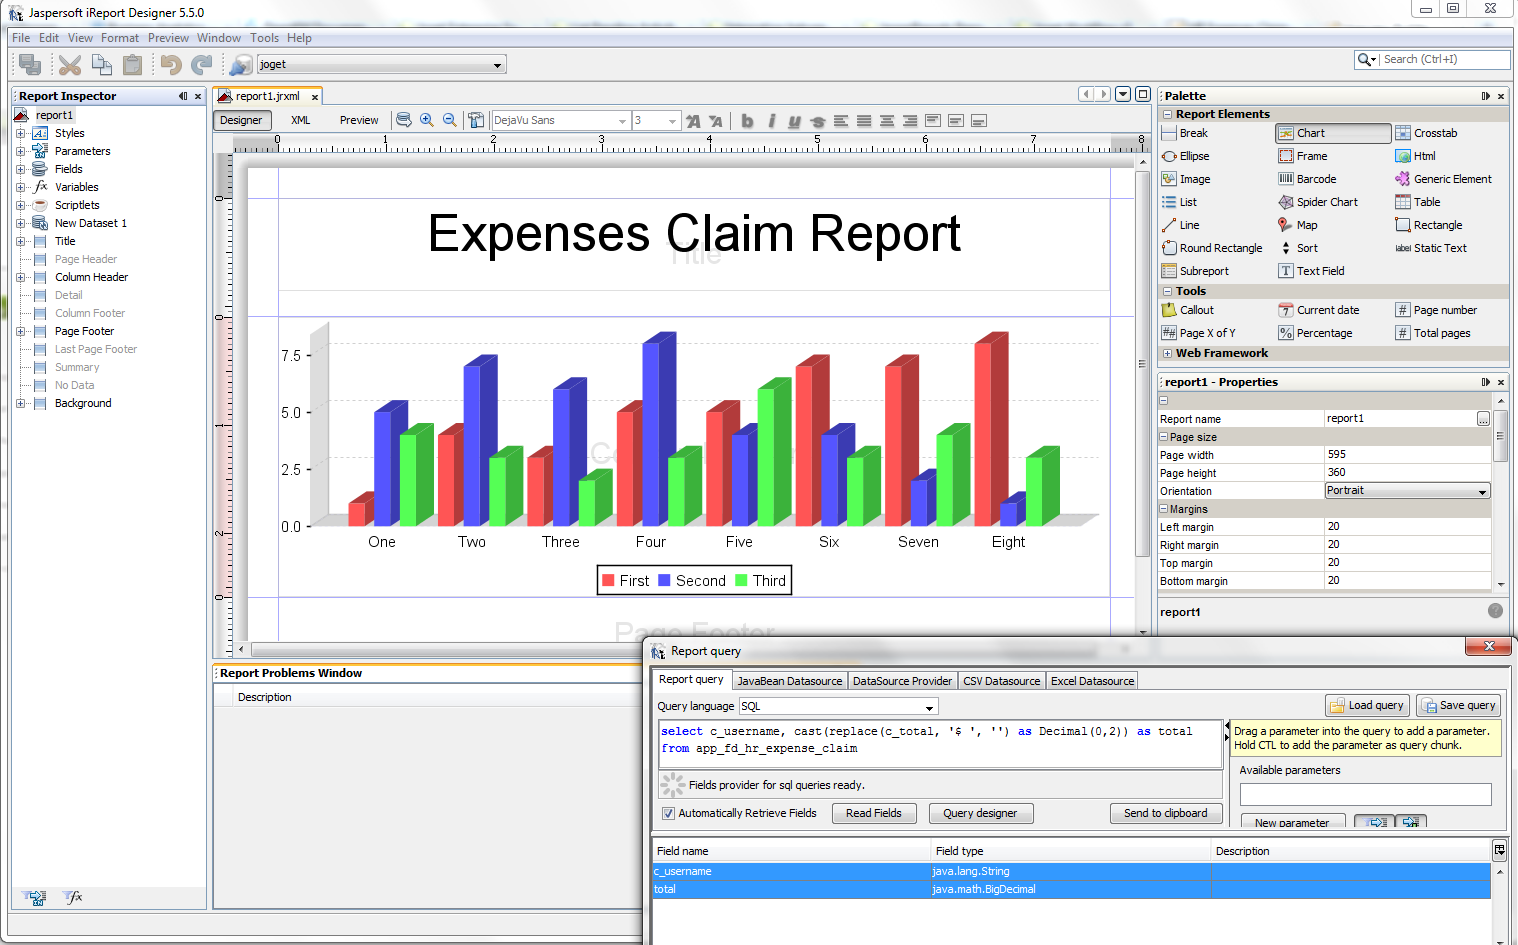
Figure 1: Designing your report in iReport Designer.
...
| Code Block | ||
|---|---|---|
| ||
select c_username, cast(replace(c_total, '$ ', '') as Decimal(0,2)) as total from app_fd_hr_expense_claim |
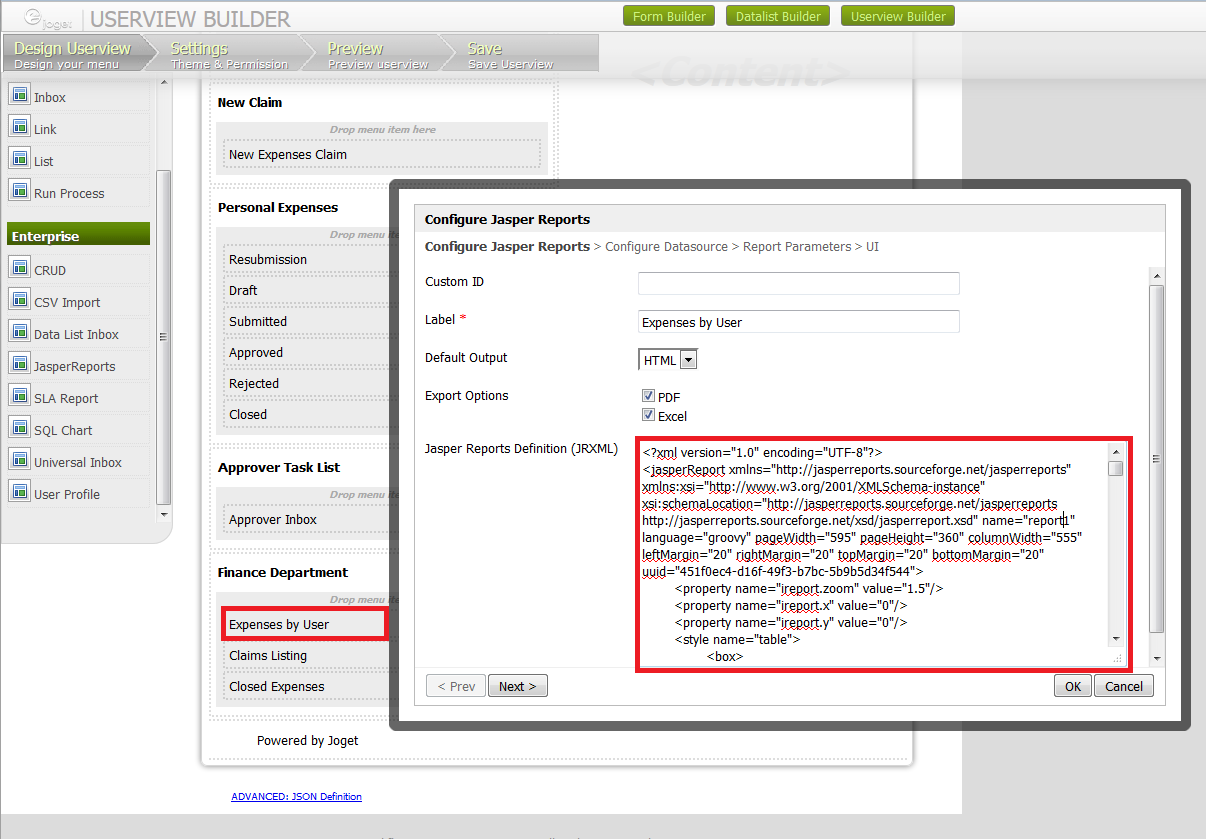
Figure 2: Adding the report definition into Joget Userview's Jasper Reports element
In your iReport Designer, click on the XML tab to copy the definition generated. Paste it into the Jasper Reports JasperReports Userview element in Joget.
At the second tab, choose select Default Datasource so that it will read the data set from Joget's current database as well.

Figure 3: Running your Report in the actual Userview
Materials and Downloads
...
Related Elements
...