...
| Name | Description | Screens (Click to view) | |||||||||||||
|---|---|---|---|---|---|---|---|---|---|---|---|---|---|---|---|
| Datasource |
|
Figure 2: SQL Chart Properties - Datasource | |||||||||||||
| Data Binder | When Datasource is set to "Using Data Binder", this option will show up. Advance Form Data Binder has more flexible ways to build chart dataset using join, group and aggregate function. Please see Datalist Binder for available binder to use. | ||||||||||||||
| SQL Query | When Datasource is set to use any of the "Datasource", this option will show up. You use an SQL Query to produce the dataset required for the graph type. The first column in the dataset will be assumed for X-axis/label. Example 1:The first column to be returned from the query must be a label (X-axis), followed by value columns for the Y-axis.
Example 2:
 |


...
| Name | Description | Screens (Click to view) | |||||||||
|---|---|---|---|---|---|---|---|---|---|---|---|
X-axis Label | X-axis Label |
| |||||||||
X-axis display as |
| ||||||||||
Y-axis Label | Y-axis Label | ||||||||||
Y-axis Prefix | Y-axis Prefix | ||||||||||
Show Legend? | If checked, legend will be shown in the generated graph. | ||||||||||
Show Value Label in Chart? | If checked, value label will be shown in the generated graph. | ||||||||||
Stack Series? | If checked, this will affect the generated graph. | ||||||||||
Display as Horizontal Chart? | Display as Horizontal Chart. | ||||||||||
| Width | Width in character, example 100%. code
100% | ||||||||||
| Height | Height in character, example 300px. Code Block | Example | 300px | ||||||||
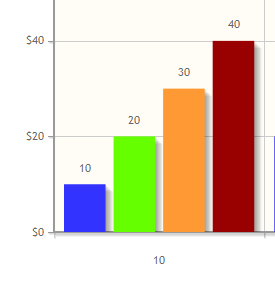
| Colors | Series color. Optional field. Comma separated values (CSV) of color codes. Example 1: Code Block |
#3333FF,#66FF00,#FF9933,#990000
Code Block |
2: red,orange,yellow,green,blue,indigo
|


...
The following code can be modified and put in "Custom Footer" for interactive Chart.
| Code Block | ||
|---|---|---|
| ||
<script>
$(document).ready(function(){
    $('#jq_plot_chart').bind('jqplotDataClick',
        function (event, seriesIndex, pointIndex, data) {
            console.log(event);
            console.log(seriesIndex);
            console.log(pointIndex);
            console.log(data);

            //for chart which used legend and x-axis,
            var xaxis = $(".jqplot-xaxis-tick:eq("+pointIndex+")");
            var series = $(".jqplot-table-legend-label:eq("+seriesIndex+")");

            console.log("x-axis :" + xaxis.text());
            console.log("series :" + series.text());
        }
    );

    //for double click event. Please note the arguments are different.
    $('#jq_plot_chart').bind('jqplotDblClick',
        function (event, coordinate, points, data) {
            console.log(event);
            console.log(coordinate);
            console.log(points);
            console.log(data);

            if (data) {
                var xaxis = $(".jqplot-xaxis-tick:eq("+data.pointIndex+")");
                var series = $(".jqplot-table-legend-label:eq("+data.seriesIndex+")");

                console.log("values :" + data.data);
                console.log("x-axis :" + xaxis.text());
                console.log("series :" + series.text());
            }
        }
    );
});
</script> |
...