The Performance Analyzer is a new feature first introduced in Joget Workflow v5 Enterprise Edition that allows administrators and app designers to analyze the performance of their apps and to identify possible bottlenecks. In Joget Workflow v6, it has been enhanced further.
When enabled, the Performance Analyzer identifies elements within a Userview where the processing time exceeds a specific threshold. Those elements in the Userview menu and current page will be highlighted when the Front-End Edit mode is active.
Figure 1: Java VM Stats and Database Connection Pool Status
Java VM Stats and Database Connection Pool Status are essential piece of information that can help administrator to manage the platform health and performance. The database connection pool gives the administrator and app designer vital information on whether there's unclosed connection or leakages of similar kind.
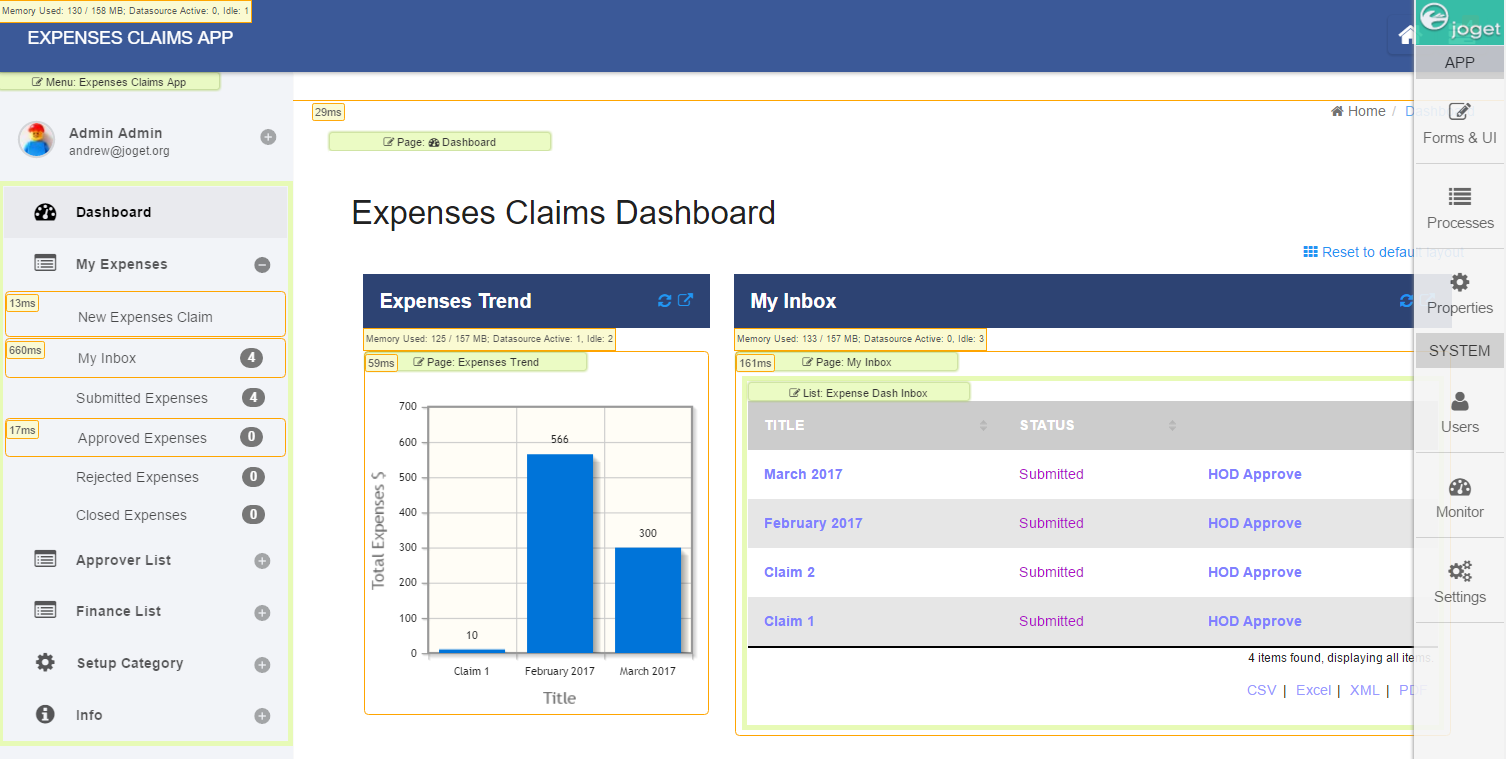
Figure 2: Statistics on elements exceeding thresholds
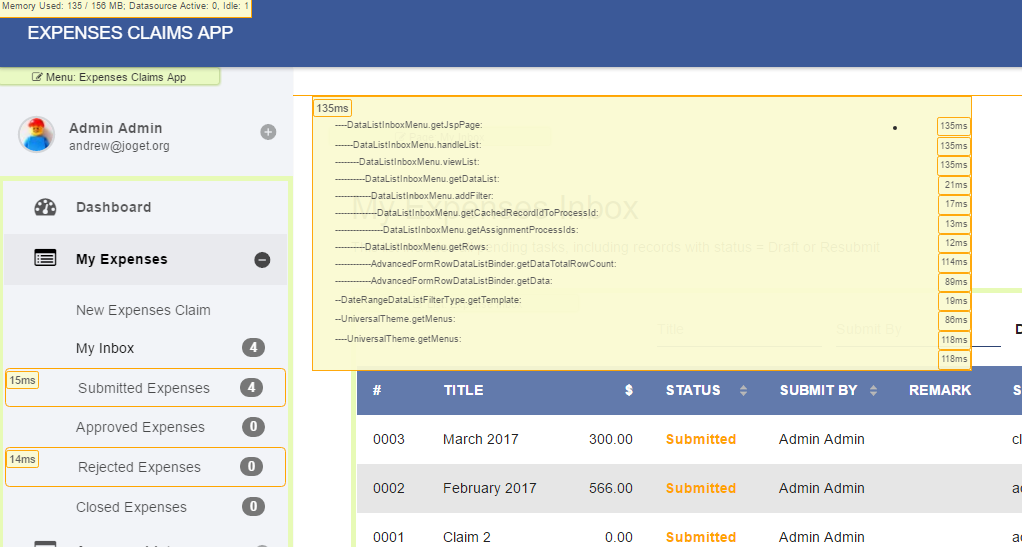
Figure 3: Specific element's analysis view
Upon mouseover of a highlighted element, details of affected method calls and/or SQL statements will be displayed.

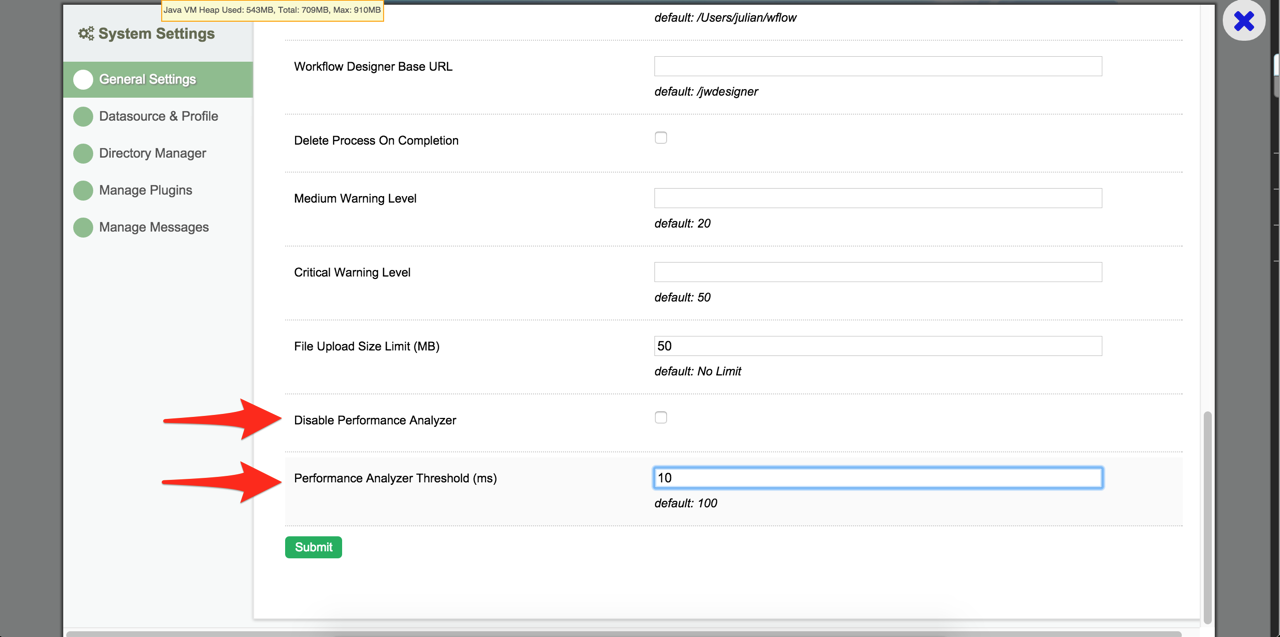
Figure 4: System Settings
By default, the Performance Analyzer is enabled with a threshold of 100ms. This setting can be overridden in the System Settings.
...