...
To hide the padding and utilizing the spacing around the chart, below code can be helpful.
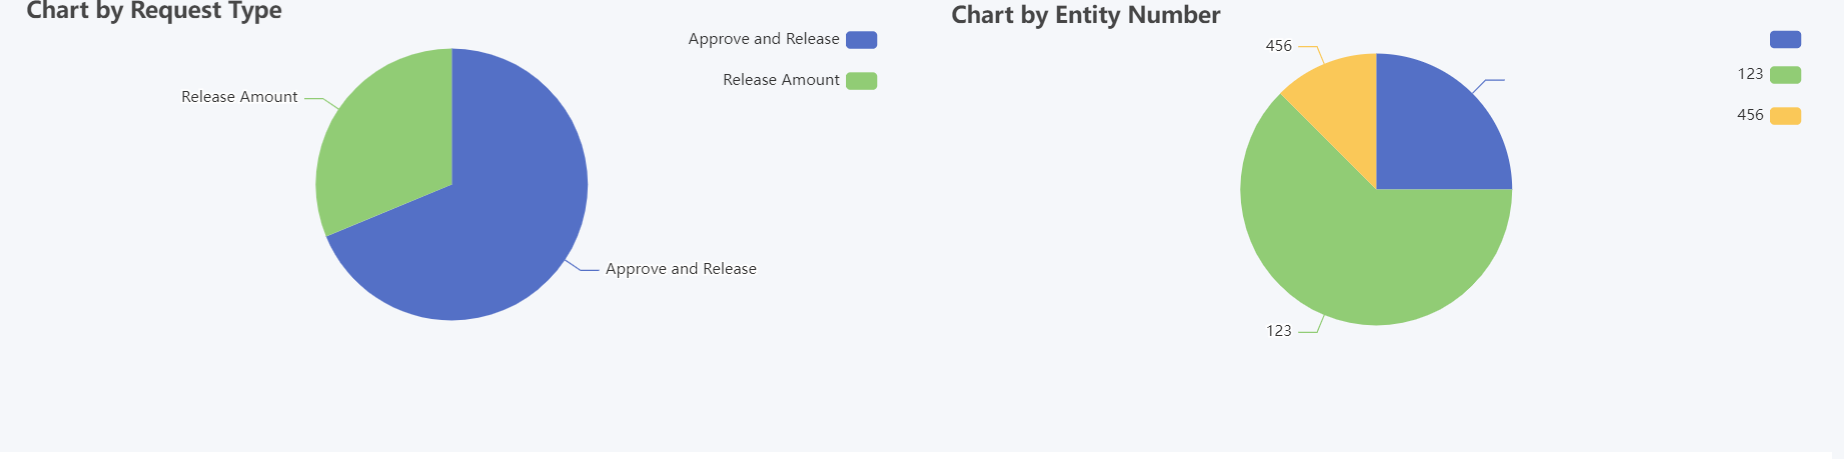
Output of the code
Code to remove padding and spacing
...
| Code Block | ||
|---|---|---|
| ||
<script>
$(document).ready(function(){

	//replace both #jq_plot_chart id with the correct id. can be found by right-clicking the chart and pressing "Inspect"
    $('#jq_plot_chart').bind('jqplotDataClick',
        function (event, seriesIndex, pointIndex, data) {
            console.log(event);
            console.log(seriesIndex);
            console.log(pointIndex);
            console.log(data);

            //for chart which used legend and x-axis,
            var xaxis = $(".jqplot-xaxis-tick:eq("+pointIndex+")");
            var series = $(".jqplot-table-legend-label:eq("+seriesIndex+")");

            console.log("x-axis :" + xaxis.text());
            console.log("series :" + series.text());
        }
    );

    //for double click event. Please note the arguments are different.
    $('#jq_plot_chart').bind('jqplotDblClick',
        function (event, coordinate, points, data) {
            console.log(event);
            console.log(coordinate);
            console.log(points);
            console.log(data);

            if (data) {
                var xaxis = $(".jqplot-xaxis-tick:eq("+data.pointIndex+")");
                var series = $(".jqplot-table-legend-label:eq("+data.seriesIndex+")");

                console.log("values :" + data.data);
                console.log("x-axis :" + xaxis.text());
                console.log("series :" + series.text());
            }
        }
    );
});
</script> |
...