这是一个快速教程,向您展示如何使用JasperReports iReport创建图表。本教程使用Joget 企业版免费提供的人力资源费用索赔应用程序作为数据集。
您将需要有iReport Designer来设计报告。

图1:在iReport Designer中设计您的报告。
在设计时,请记住指向Joget的数据库。在iReport Designer中创建您的报告。您可以使用本示例中使用的SQL。
This is a quick tutorial to show you on how to create a graph using JasperReports iReport. This tutorial uses the HR Expenses Claim App that comes for free in the Enterprise Edition of Joget as the data set.
You will need to have iReport Designer in place to design the report.
Figure 1: Designing your report in iReport Designer.
When designing, remember to point to Joget's database. Create your report in iReport Designer. You may use the SQL used in this example.
| Code Block | ||
|---|---|---|
| ||
select c_username, cast(replace(c_total, '$ ', '') as Decimal(0,2)) as total from app_fd_hr_expense_claim |
 Figure 2: Adding the report definition into Joget Userview's Jasper Reports element
In your iReport Designer, click on the XML tab to copy the definition generated. Paste it into the Jasper Reports Userview element in Joget.
At the second tab, choose Default Datasource so that it will read the data set from Joget's current database as well.
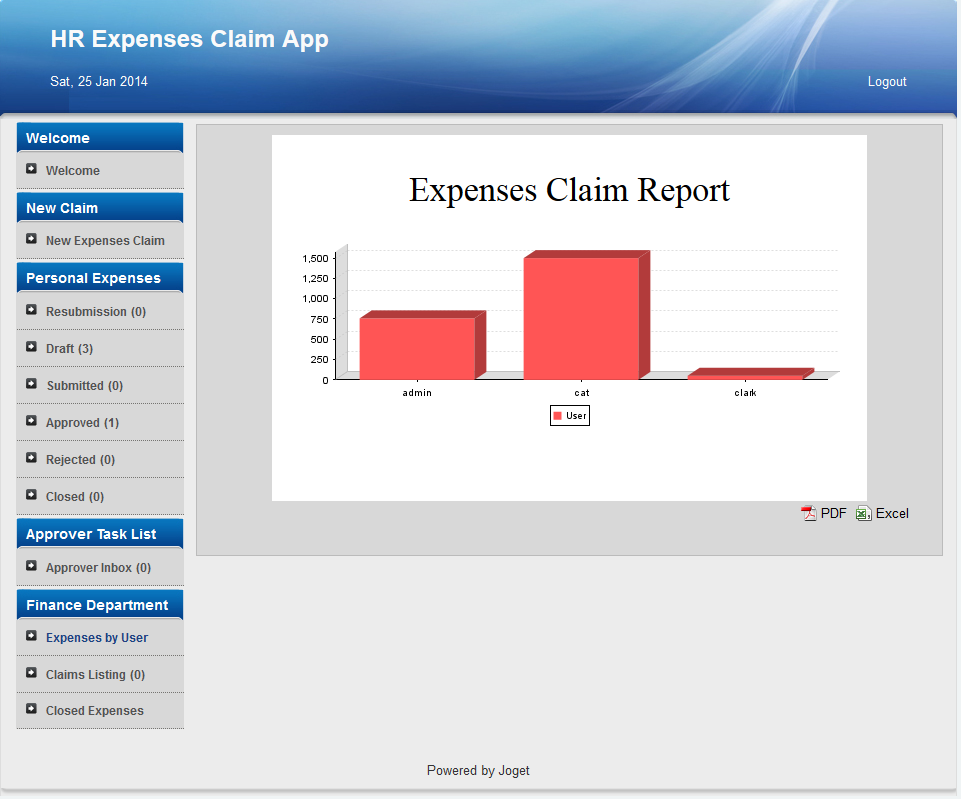
Figure 3: Running your Report in the actual Userview
...
图2:将报告定义添加到Joget Userview的Jasper Reports元素中
在您的iReport设计器中,单击XML选项卡复制生成的定义。将它粘贴到Joget的Jasper Reports Userview元素中。
在第二个选项卡上,选择默认数据源,以便从Joget的当前数据库中读取数据集。
图3:在实际的用户视图中运行您的报告
材料和下载
...