| Panel | ||||||||||
|---|---|---|---|---|---|---|---|---|---|---|
| ||||||||||
SQL Chart allows you to define your own SQL query to determine the charts that you would like to generate, ranging from a number of graph types. |

Figure 1: SQL Chart Properties
| Name | Description | |||||
|---|---|---|---|---|---|---|
| Custom ID | Item link slug. Optional field.
| |||||
| Label | Menu label. Mandatory field. | |||||
| Chart Type |
| |||||
| Chart Title | Chart Title to be displayed part of the generated graph. |

Figure 2: SQL Chart Properties - Chart Options
| Name | Description | |||||||||||||||
|---|---|---|---|---|---|---|---|---|---|---|---|---|---|---|---|---|
X-axis Label | X-axis Label | |||||||||||||||
X-axis display as |
| |||||||||||||||
Y-axis Label | Y-axis Label | |||||||||||||||
Y-axis Prefix | Y-axis Prefix | |||||||||||||||
Show Legend? | If checked, legend will be shown in the generated graph. | |||||||||||||||
Show Value Label in Chart? | If checked, value label will be shown in the generated graph. | |||||||||||||||
| Width | Width in character.
| |||||||||||||||
| Height | Height in character.
| |||||||||||||||
| Colors | Series color. Optional field. Comma separated values (CSV) of color codes. Example:
|

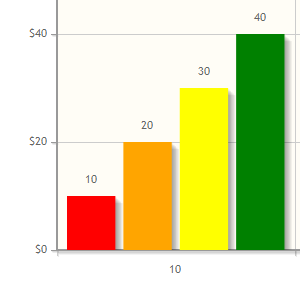
Figure 3: SQL Chart Properties - SQL
|

Figure 2: SQL Chart Properties - Datasource
| Name | Description | |||||||||||||
|---|---|---|---|---|---|---|---|---|---|---|---|---|---|---|
| Datasource |
| |||||||||||||
| Data Binder | When Datasource is set to "Using Data Binder", this option will show up. Please see Datalist Binder for available binder to use. | |||||||||||||
| SQL Query | When Datasource is set to use any of the "Datasource", this option will show up. | |||||||||||||
| Name | Description | |||||||||||||
| SQL Query SQL Query to produce the dataset required for the graph type.
The first column to be returned from the query must be a label (X-axis), followed by value columns for the Y-axis. Example 1:
Example 2:

|


Figure 43: SQL Chart Properties - UI- Data Binder & Chart Data Mapping (applicable for - using Data Binder)
| Name | Description |
|---|---|
| Custom Header | Custom Header in HTML. |
| Custom Footer | Custom Footer in HTML. |
Figure 5: SQL Chart Properties - Advanced
| Order By | Column to be sorted in the graph dataset. This would affect how the graph is plotted. |
| Order |
|
X-axis Value | X-axis label. |
Y-axis Values | Y-axis dataset. |
Figure 4: SQL Chart Properties - Chart Options (applicable for - using Datasource)
| Name | Description | |||||||||||||||
|---|---|---|---|---|---|---|---|---|---|---|---|---|---|---|---|---|
X-axis Label | X-axis Label | |||||||||||||||
X-axis display as |
| |||||||||||||||
Y-axis Label | Y-axis Label | |||||||||||||||
Y-axis Prefix | Y-axis Prefix | |||||||||||||||
Show Legend? | If checked, legend will be shown in the generated graph. | |||||||||||||||
Show Value Label in Chart? | If checked, value label will be shown in the generated graph. | |||||||||||||||
Stack Series? | If checked, this will affect the generated graph. | |||||||||||||||
Display as Horizontal Chart? | Display as Horizontal Chart. | |||||||||||||||
| Width | Width in character.
| |||||||||||||||
| Height | Height in character.
| |||||||||||||||
| Colors | Series color. Optional field. Comma separated values (CSV) of color codes. Example:
|

Figure 5: SQL Chart Properties - Advanced
| Name | Description | ||||||||||
|---|---|---|---|---|---|---|---|---|---|---|---|
| Name | Description | ||||||||||
| Datasource |
If the default datasource is selected, the custom JDBC settings below will be ignored. | ||||||||||
Userview Key Name | When defined, additional condition will be appended using the value defined here as the parameter and the userview key value as the value.
When userview key value is defined, you may define #userviewKey# in your SQL query to have it replaced with the userview key value.
| ||||||||||
Custom Header | Custom Header in HTML. | ||||||||||
Custom Footer | Custom Footer in HTML. |
Interactive Chart
The following code can be modified and put in "Custom Footer" for interactive Chart.
...