...
Chart Menu Properties
Configure Chart Menu
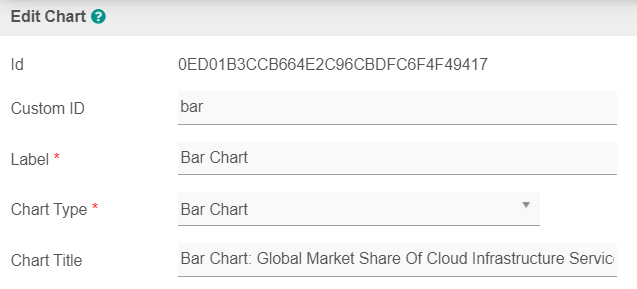

Figure 1: Edit Chart Properties
...
| Name | Description |
|---|---|
| Order By | Column to be sorted in the graph dataset. This would affect how the graph is plotted. |
| Order |
|
X-axis Value | X-axis label. |
Y-axis Values | Y-axis dataset. |
Chart Options Properties


Figure 4: Chart Options
...
| Name | Description | |||||
|---|---|---|---|---|---|---|
X-axis Label | X-axis Label | |||||
X-axis display as |
| |||||
Y-axis Label | Y-axis Label | |||||
Y-axis Prefix | Y-axis Prefix | |||||
Show Legend? | If checked, the legend will be shown in the generated graph. | |||||
Show Value Label in Chart? | If checked, the value label will be shown in the generated graph. | |||||
Stack Series? | If checked, this will affect the generated graph. | |||||
Display as Horizontal Chart? | Display as Horizontal Chart. | |||||
| Width | Width in character, for example 100%. | |||||
| Height | Height in character, example 300px. | |||||
| Colors | Series color. Optional field. Comma-separated values (CSV) of color codes. Example 1: #3333FF,#66FF00,#FF9933,#990000
|

Advanced Properties


Figure 5: Advanced Properties
...