Identify Performance Bottlenecks using Application Performance Monitor (APM)
This is a new feature in Joget DX Enterprise Edition
Introduction
Application Performance Management (APM) is a built-in feature that automatically monitors system and application performance. The monitoring is done at runtime, and alerts can be configured for various metrics including errors so that email notifications are sent when thresholds are exceeded.
How do I access the System APM?
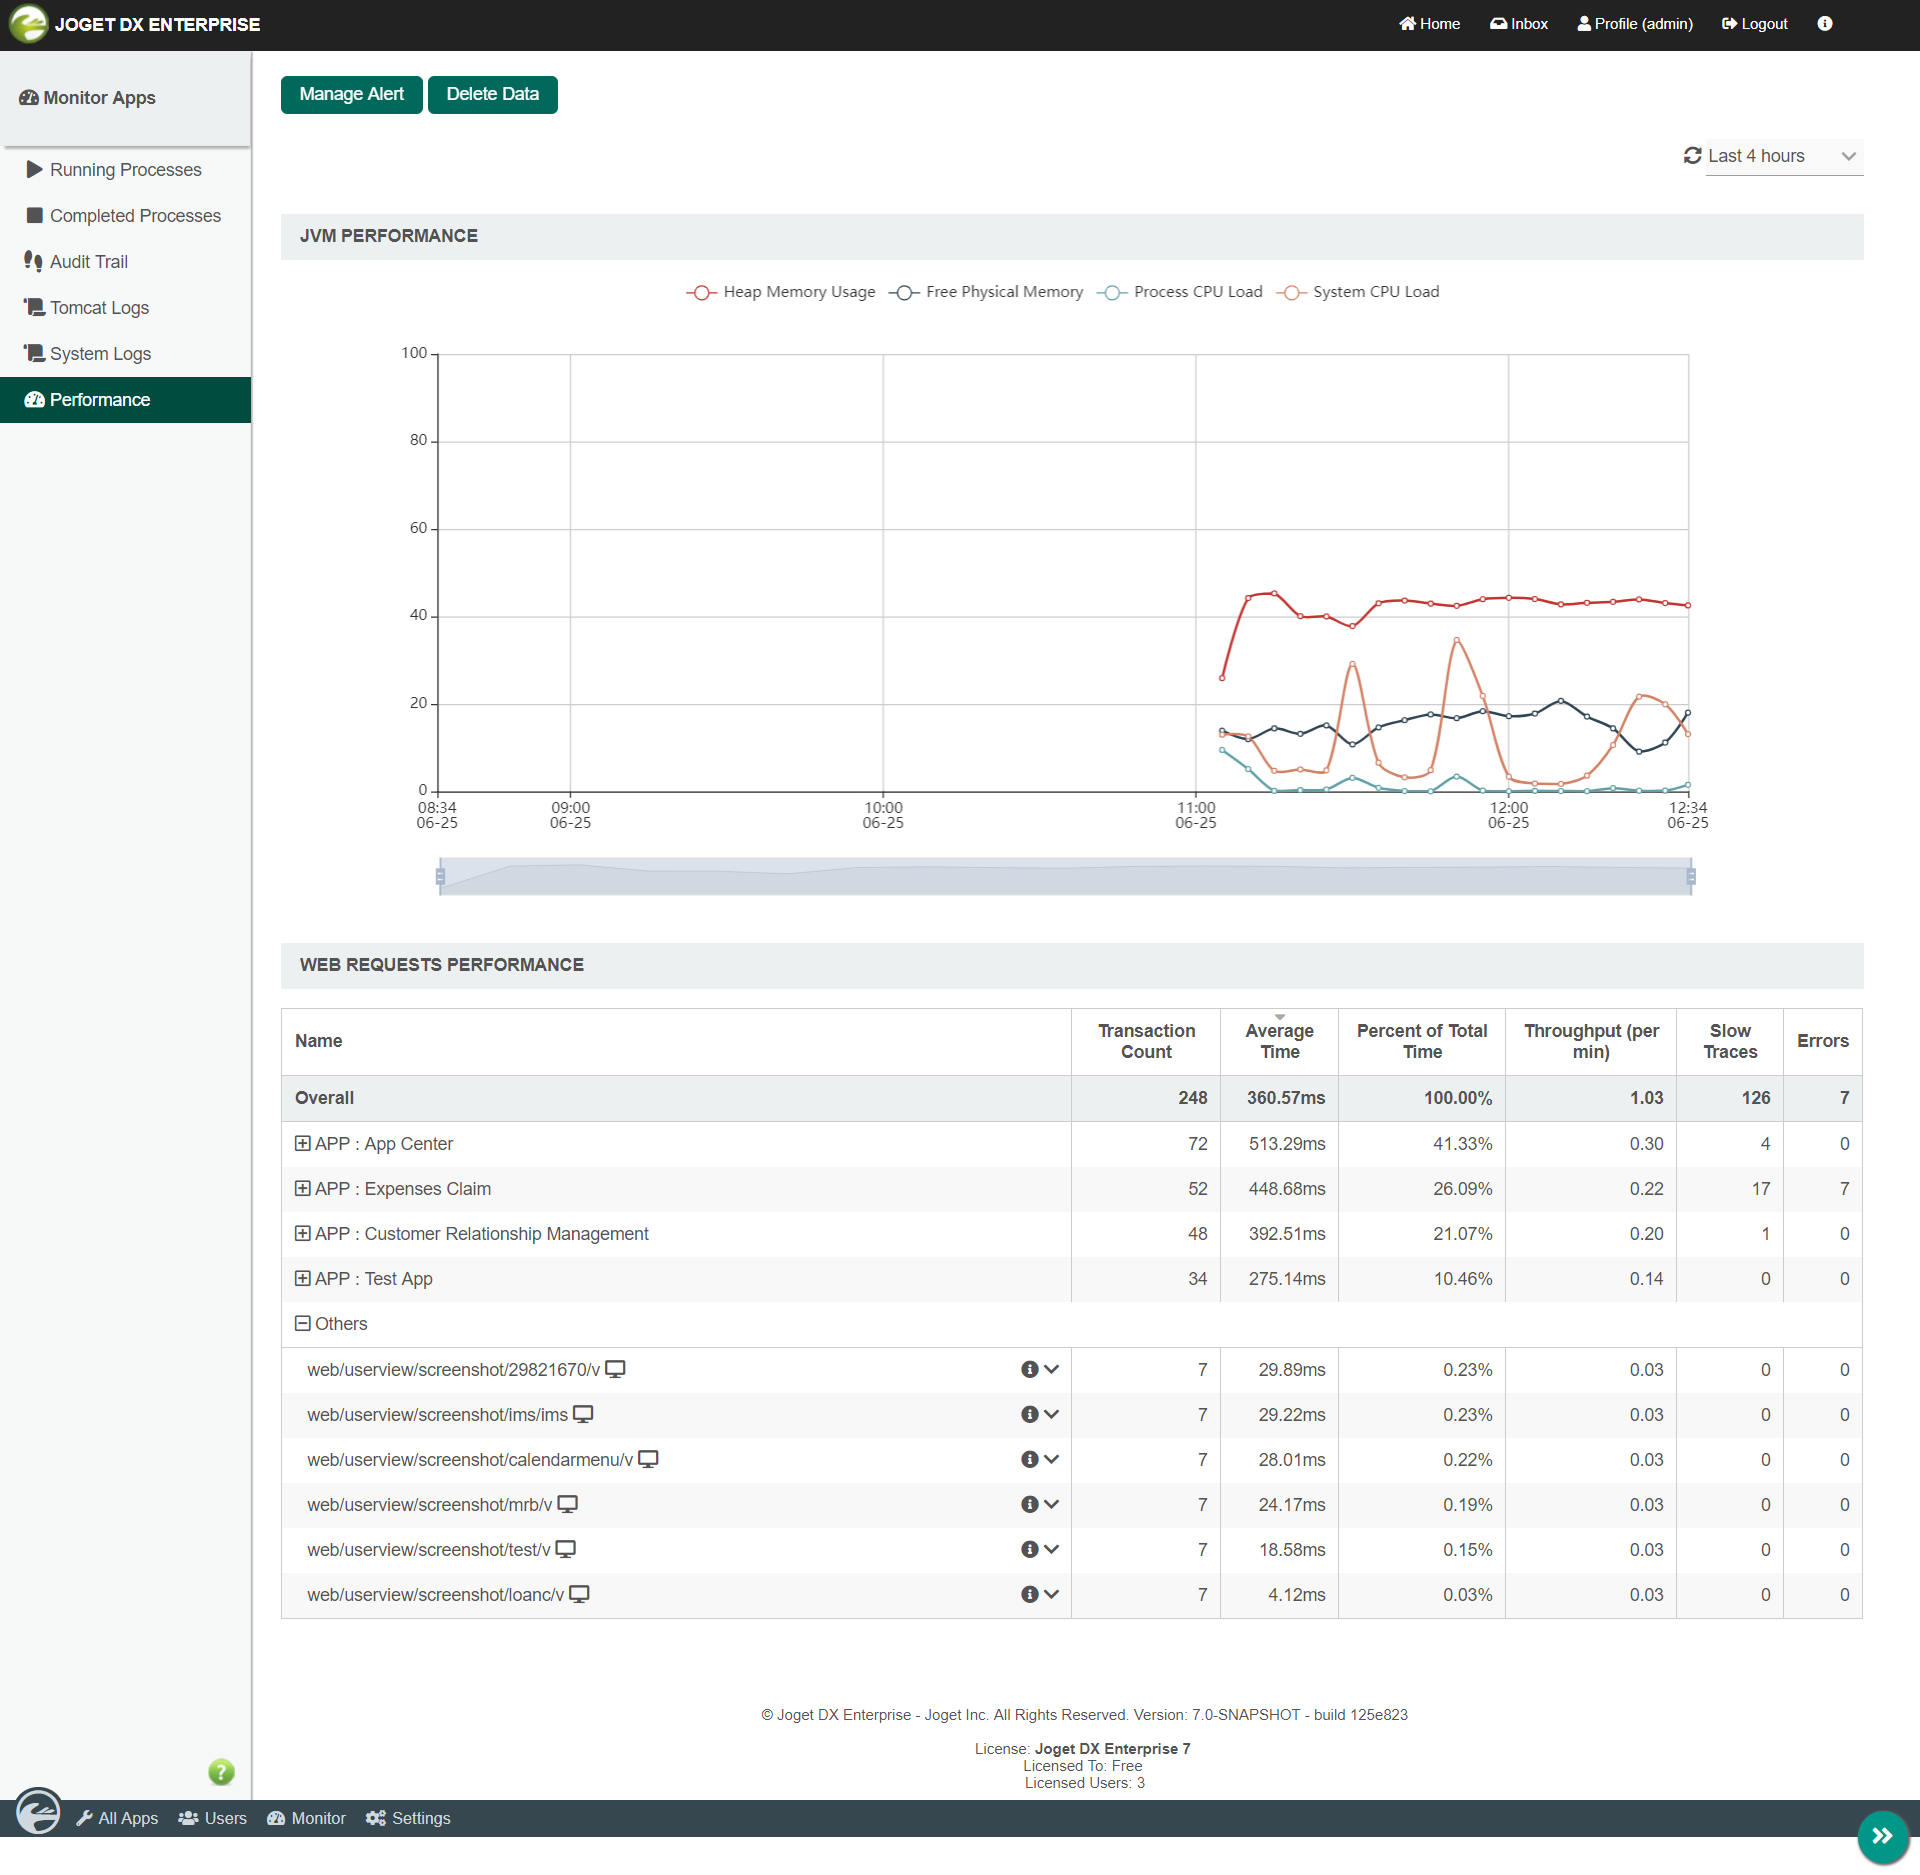
| Steps |
|---|
|
How do I access to the APM in my App?
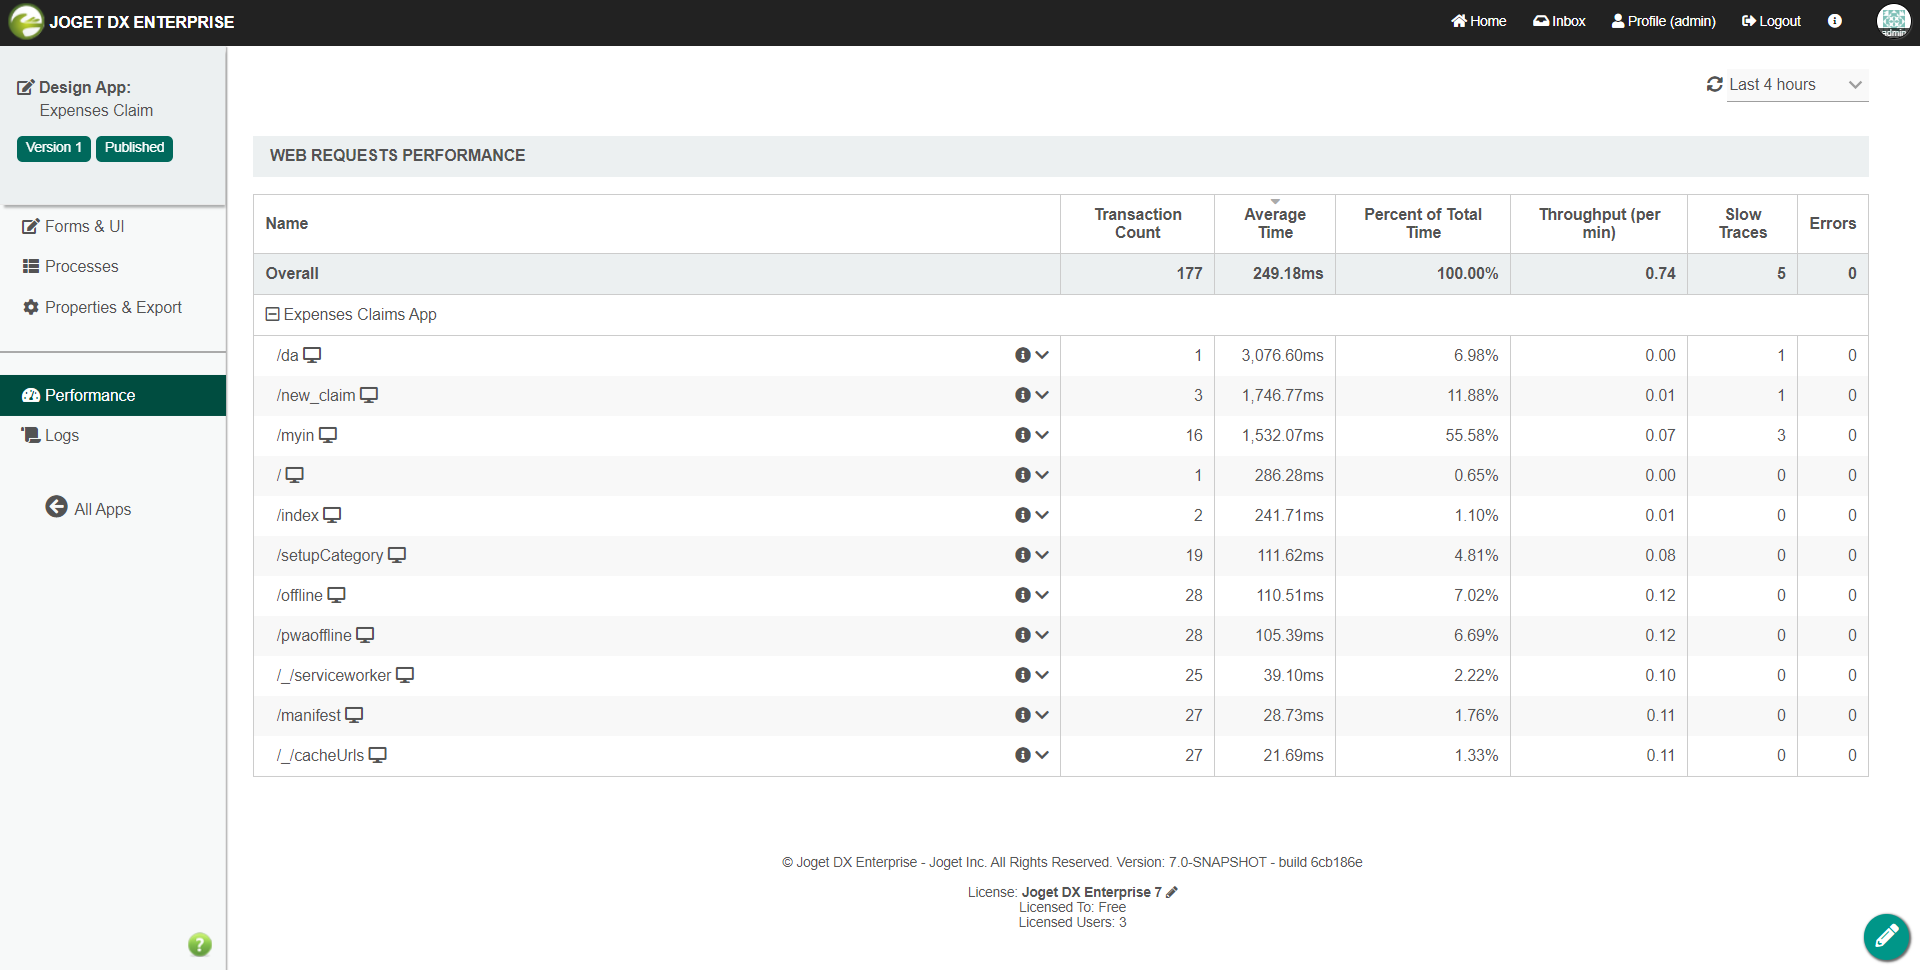
| Steps |
|---|
|
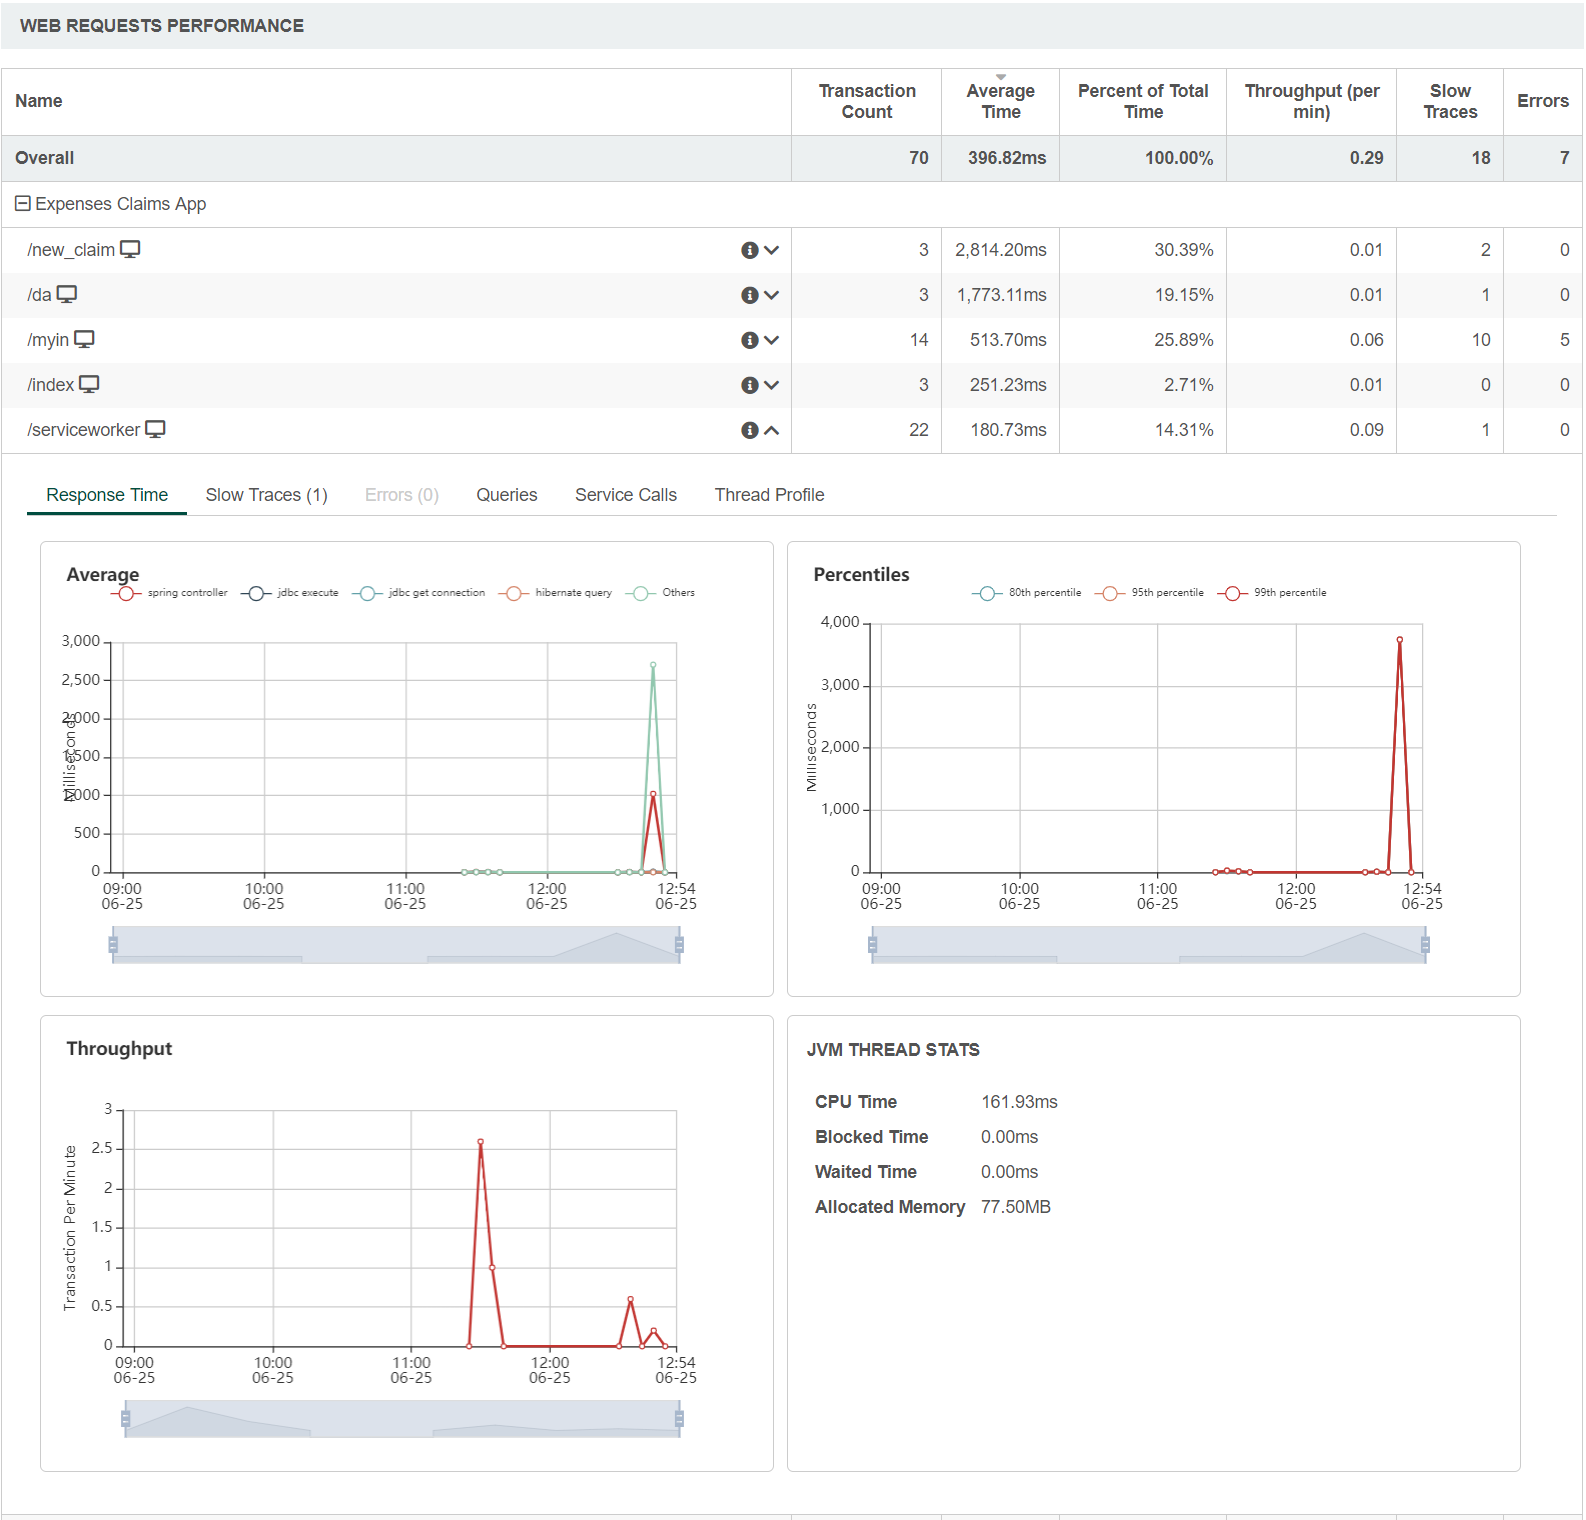
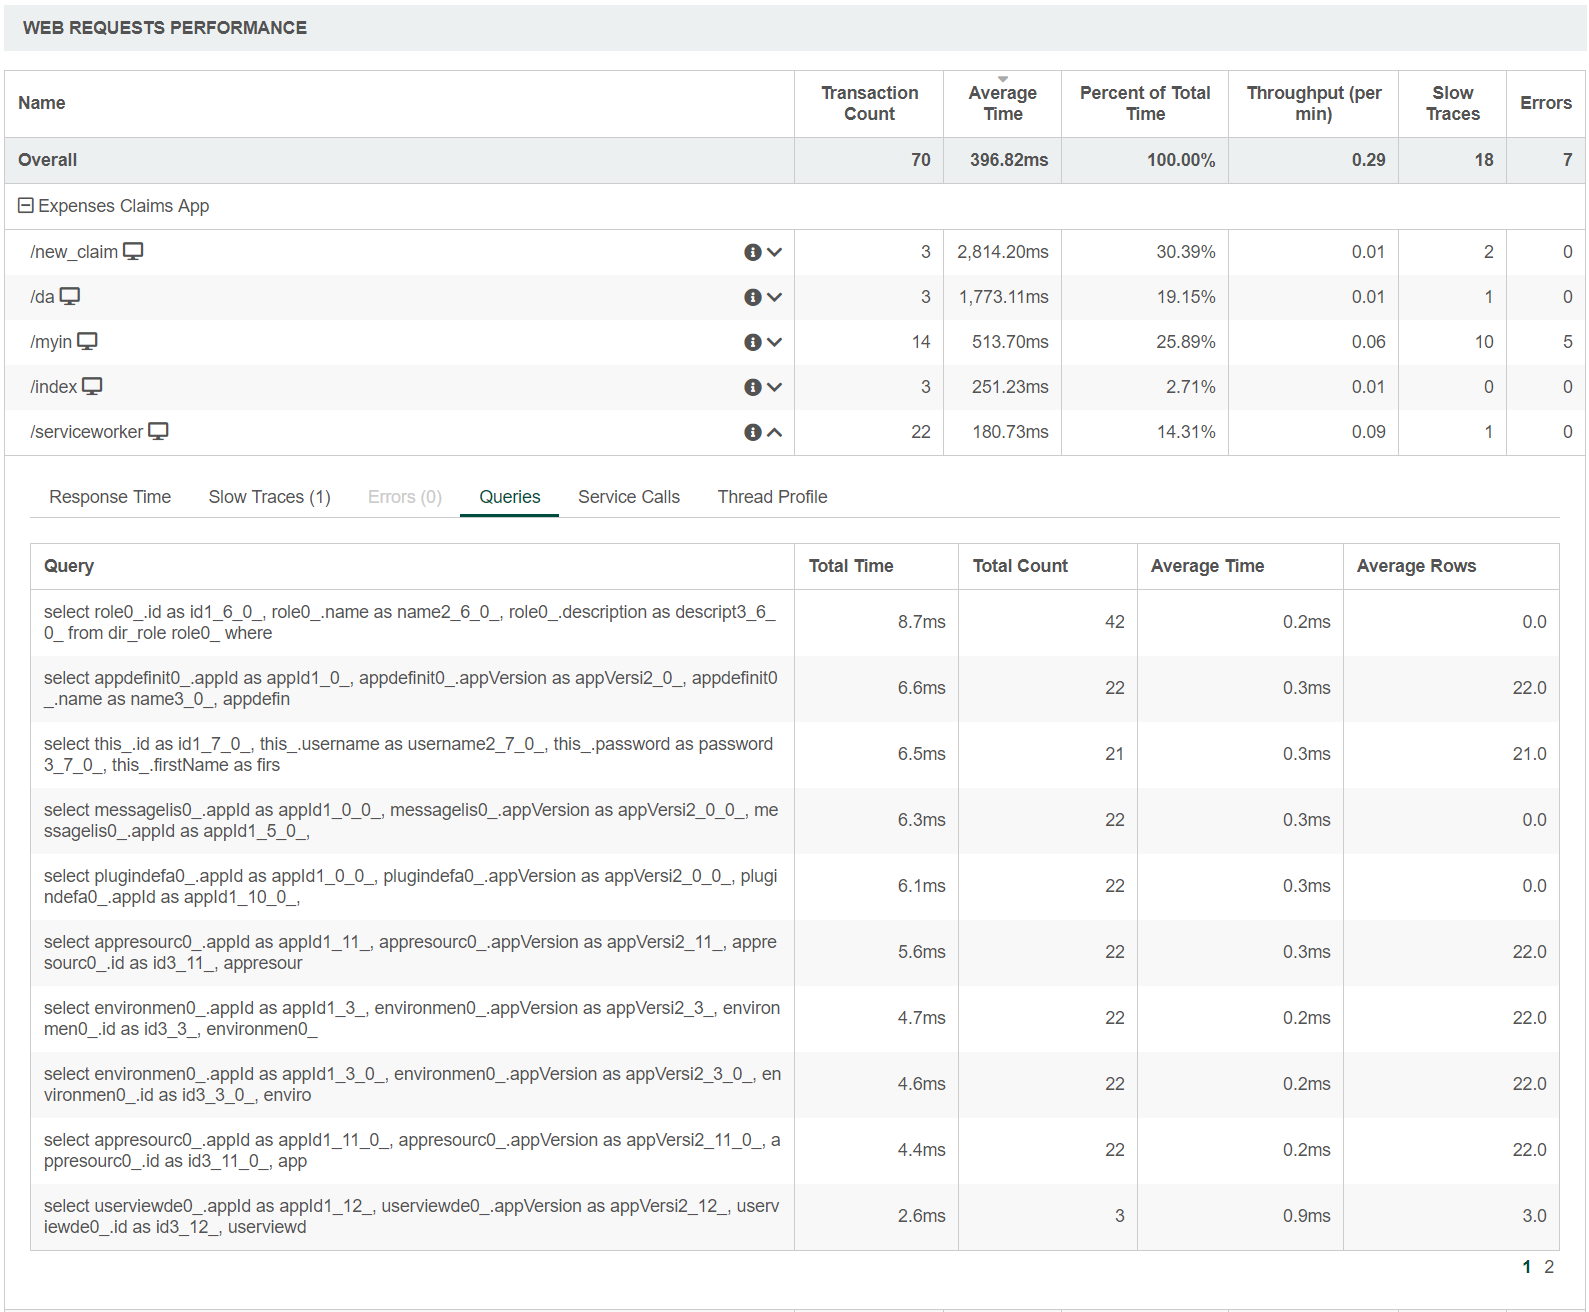
Web Request Performance
| Features |
|---|
Response Time
|
Slow Traces
|
Errors
|
Queries
|
Service Calls
|
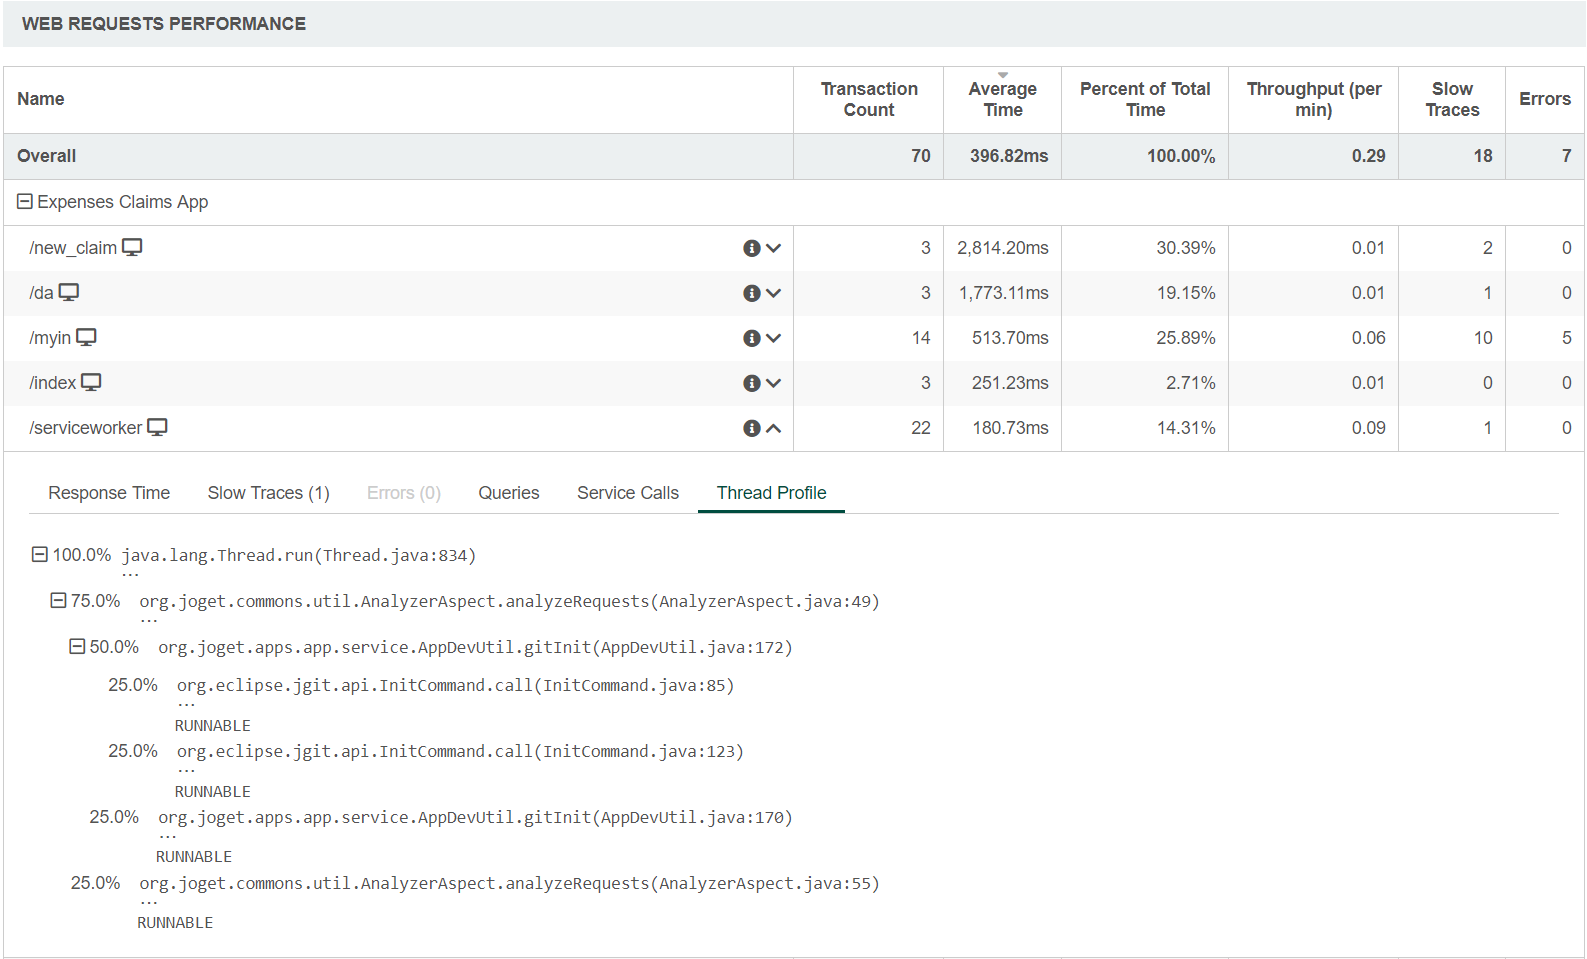
Thread Profile
|

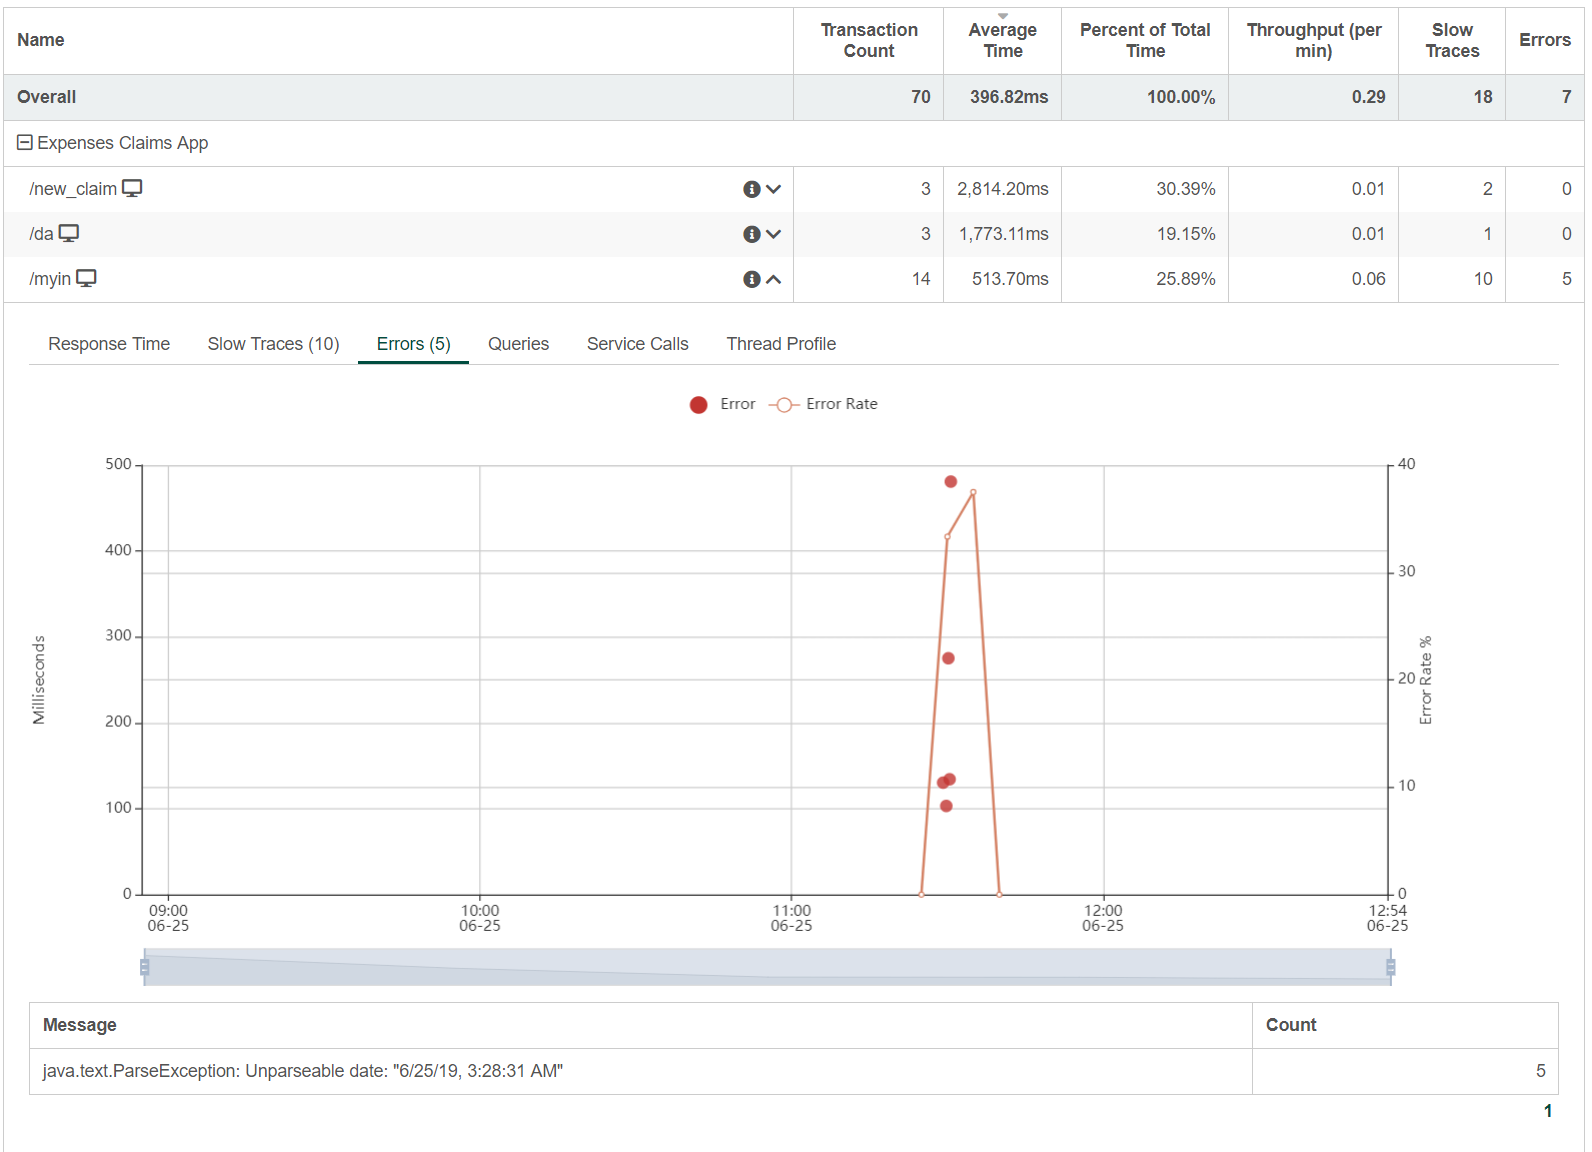

Download Slow / Error Trace
For further analysis, the slow / error trace can be downloaded by clicking on the bubble on the chart itself. Then, click on the download link to download.

Application Performance Management (APM) properties
| Name | Description |
|---|---|
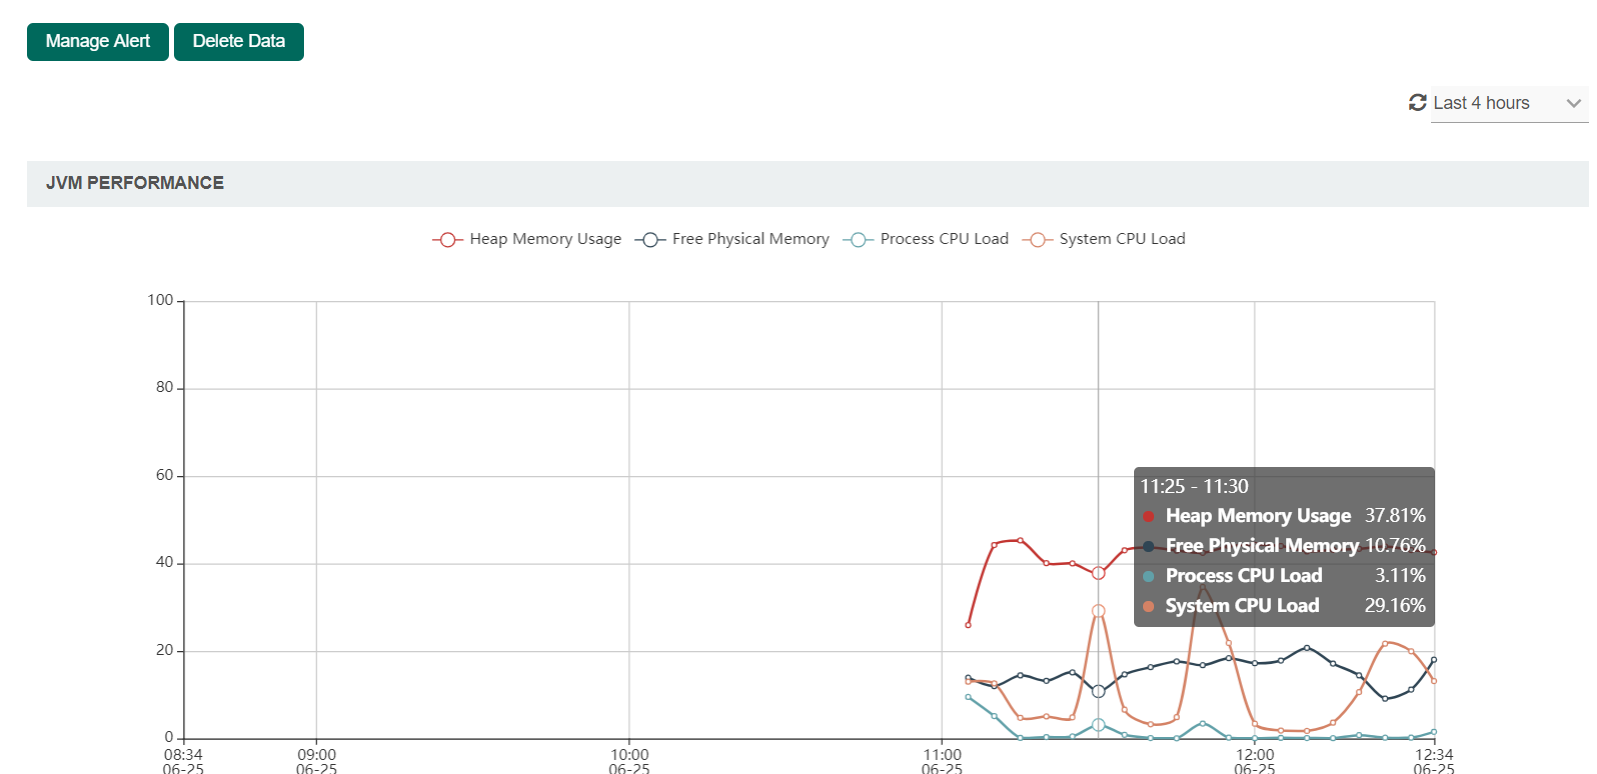
| Manage Alert | Set up an email Performance Alert notification. Note This is only available in the System (APM) under the Monitor > Performance menu. |
| Delete Data | A prompt will be displayed to confirm the deletion of performance data. Note This is only available in the System (APM) under the Monitor > Performance menu. |
|
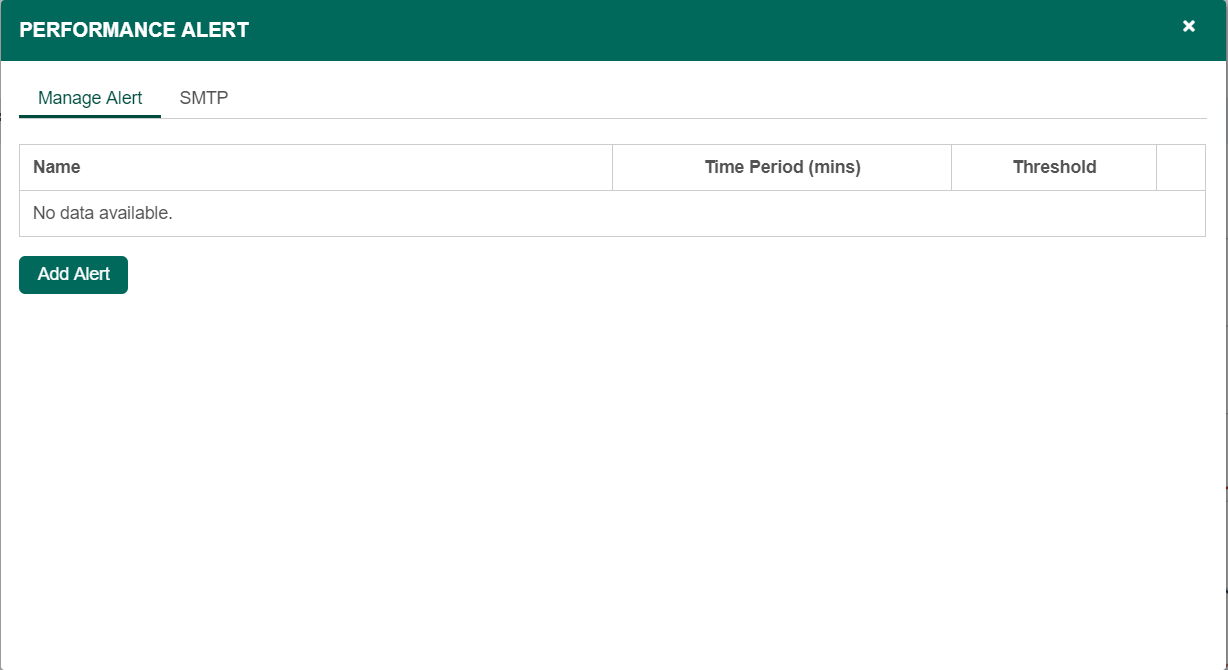
Performance Alert
Manage Alert
| Name | Description |
|---|---|
| Add Alert | Setup an alert |
Add Alert
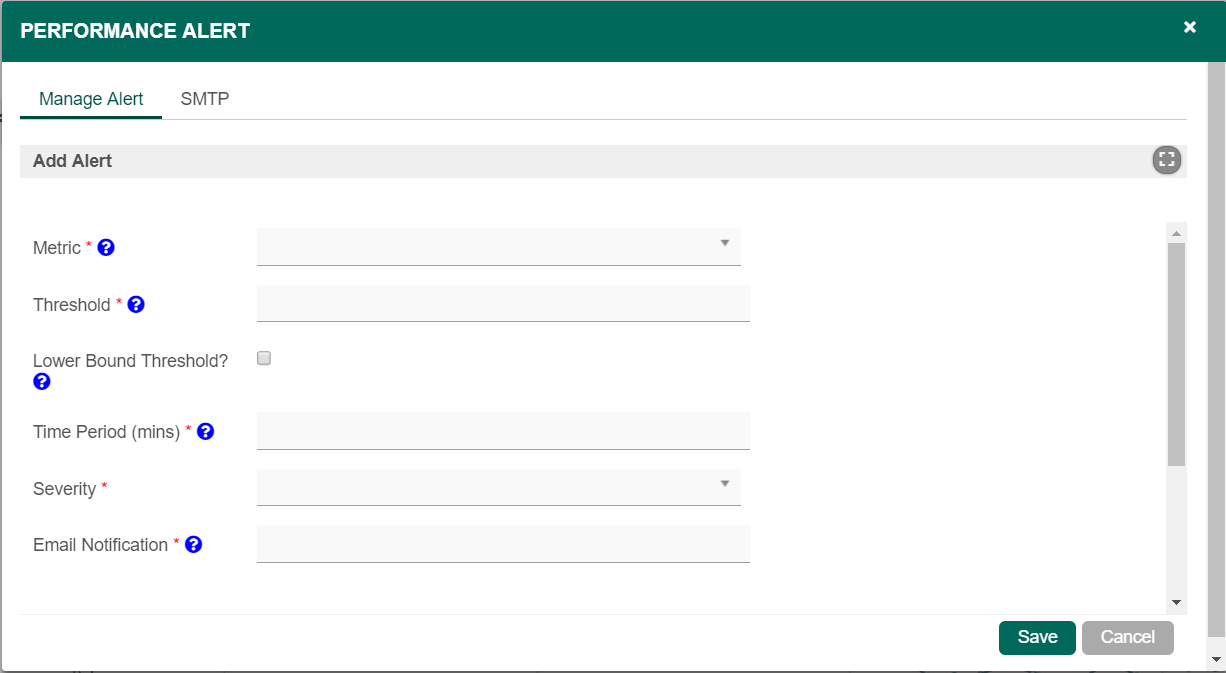
| Name | Description |
|---|---|
| Metric | The metric that this alert monitors. Available Metrics:
|
| Threshold | If the metric value over the given time period is greater than or equal to this threshold, then alert will be triggered |
| Lower Bound Threshold? | Alert if the metric value is less than or equal to the threshold, instead of alerting if it is greater than or equal to the threshold. |
| Time Period (mins) | The time period over which the metric is calculated. |
| Minimum Transaction Count | Time periods with very few transactions have much less meaningful metrics, so this can be used to suppress alerts from being generated unless the time period has a minimum transaction count. Note This field will be displayed if Error Rate (%) is selected in the Metric field. |
| Severity |
|
| Email Notification | A comma-separated list of email addresses. |
SMTP
If no SMTP settings are configured here, this tool will read the SMTP configuration in the "General Settings".
You may configure common SMTP settings in "General Settings > SMTP Settings" for your future convenience.
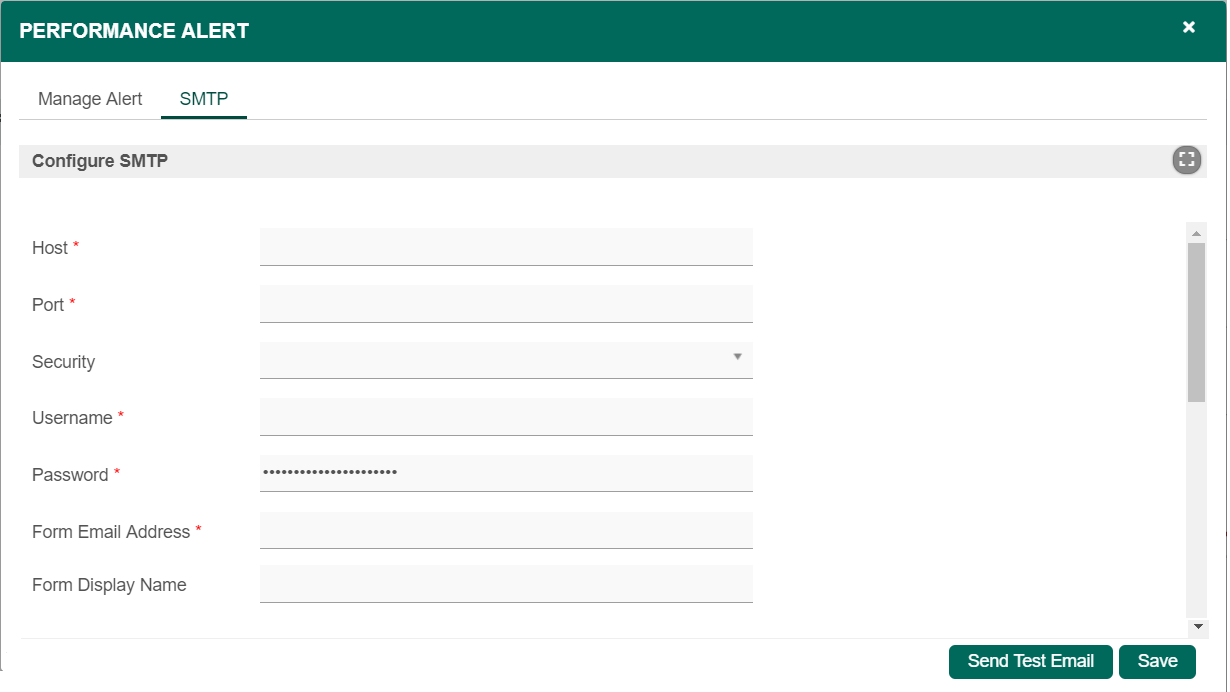
| Name | Description |
|---|---|
| Host | Email Server SMTP Host Example |
| Port | Email Server SMTP Port Typically, port 465 for SSL security option and 587 for TLS |
| Security |
|
| Username | Email Server Account Username On Google email account, use your full email address. |
| Password | Email Server Account Password Password submitted will be encrypted for security reason. |
| From Email Address | sender email address |
| From Display Name | sender display name Example Info No Reply |
Quick Test
Identify Performance Bottlenecks using Performance Analyzer
The saying from renowned computer scientist Donald Knuth goes:
“We should forget about small efficiencies, say about 97% of the time: premature optimization is the root of all evil. Yet we should not pass up our opportunities in that critical 3%.”
Before wasting any effort on optimization, it is important to identify where the specific problems or inefficiencies are first.
Identify elements in your userview pages and menu that require significant amounts of SQL or BeanShell scripts. These are the common causes of performance issues.
Use the Performance Analyzer to help identify the slow elements in your app
Identify slow SQL queries in your app by leveraging on your database e.g. for MySQL you can use the Slow Query Log
Check your custom plugins to ensure that they do not introduce slow processing, database queries, etc.
Identify whether there are sufficient resources (physical memory, storage space, Java VM allocation, etc) to handle your app usage, and whether there are any resource leakages.
Ensure Sufficient Java VM Memory Allocation
The platform runs on the Java VM (JVM), and depending on the size and complexity of your apps and usage, you might need to tune the JVM heap memory size to suit your environment. If the setting is too low, the system will run out of memory resulting in OutOfMemory errors. However if the setting is too high compared the amount of physical RAM available, there might be quite a lot of swapping, in addition to overheads in garbage collection.
The default JVM settings are quite low to support installation on a user’s individual computer for testing or development. To get an optimum setting might require a bit of trial and error sometimes, depending on the usage environment.
You can use tools like VisualVM to monitor the memory usage as per Monitoring using VisualVM.
Some additional details are available at Deployment Best Practices#JavaVMConfiguration.
Eliminate Resource Leakage (Memory, Database Connections, Files, Network, etc)
At the platform level, Joget Workflow has been optimized and tested to ensure that there are no resource leakages.
However, it is very possible to introduce these problems into your app. For example, you might be creating and using database connections without closing them. This would cause your database connection pool to be exhausted, and eventually cause the system to grind to a halt. When using custom Java or JDBC code in a BeanShell script or custom plugin, database connections must be closed in a try-catch finally loop e.g.
Connection con = null;
try {
   // get connection
   con = datasource.getConnection();

   // more processing
} finally {
   // close connection
   try {
       if (con != null) {
           con.close();
       }
   } catch (Exception e) {
   }
}
Likewise, any custom code that creates objects, network connections or file IO must release such resources in a try-finally block. An indication of unreleased memory would manifest itself in the Java VM memory usage, which would continually increase without reducing over time.
Using a tool like VisualVM, you will be able to monitor the memory usage.
The database connection usage can be monitored in your database server, or use the v6 Database Connection Monitoring and Leak Detection feature.
Optimize your App and Database Queries
Joget Workflow has been thoroughly profiled and optimized to ensure that there is minimal overhead at the platform level. However, in enterprise apps that rely on dynamic data, each page request would require many database queries. Database calls are slow not just in query execution, but especially in network I/O. In most cases, database calls are the main performance bottlenecks that cause lengthy page response times and limit scalability.
It is therefore significant to minimize the number of database calls that are made in the app. Check through your app to ensure that any database calls (or processing) are really necessary, if not remove them.
This also applies not just to the main userview page, but also in the userview menus. For example, displaying a count of items in the menus incur a potentially slow database query, so you need to make a decision on whether or not to display it. You can test the performance of a page with and without menus by using the Userview Embedded Mode.
In the upcoming v6, there will be a new Userview Caching feature to optionally cache userview pages and menus for a significant performance boost.
Tune the Database and Application Server
For apps that require a lot of database queries, you would want to optimize both your database and database server configuration. Depending on the type of database server used, your database administrator would be best placed to perform such tuning based on your usage pattern. For example, MySQL has a section on optimization in the documentation http://dev.mysql.com/doc/refman/5.6/en/optimization.html.
There are some additional information at Deployment Best Practices#DatabaseConfiguration.
If there are a lot of concurrent requests to your app, it might also be prudent to tune your application server as per Deployment Best Practices#WebApplicationServerConfiguration.
Do update your database server to the latest MySQL releases. New stable database engine releases usually have performance improvments.
If you use a lot of form grids with parent and child database tables, do add indexes to your foreign key child table. This will speed up retrieval of the child form records.
Load Test your App and Server Sizing
There are many factors involved in determining the server specifications needed to run Joget Workflow effectively. These are some of the non-conclusive factors:
Total number of users
Maximum expected concurrent users
Number of apps running on the platform
Complexity of each of the apps
Amount of data generated in each app
Network infrastructure
For example, an environment with a small number of users running a heavily-used complex app might require more resources than an environment with large number of users running some simple apps only once a day.
So based only on number of maximum and concurrent users, you wouldn't be able to predict what is needed. Usually installations would start with a single application server first, and scale up or cluster when necessary.
To determine the actual requirement for your app and usage, it is best to perform load testing in your environment. There are many free and commercial load testing available, there is an article using the open source Apache JMeter tool at Joget Workflow Clustering and Performance Testing on Amazon Web Services (AWS)
Introduce Clustering and Load Balancing
When you have optimized your apps, you can increase your server capacity as appropriate to handle increasing load (vertical scaling). You can also start to consider performing horizontal scaling i.e. to cluster or load balance your installation. This can not only handle increased load, but also offer high availability. Read more on this at Deployment Best Practices#ClusteringandLoadBalancing.