1
0
-1
2 answers
- 10-1
Issue resolved
the log said that it was an issue with the SQL code.
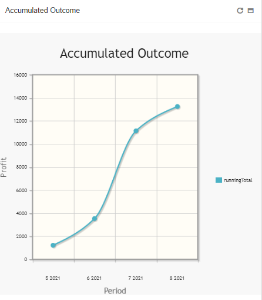
I was able to rewrite my SQL code, in a way that Joget was able to handle:
SELECT
Period,
@runningTotal := @runningTotal + totals.Outcome AS runningTotal
FROM
(Select CONCAT(MONTH(c_CDate),' ',YEAR(c_CDate))as Period,
sum(c_OutComePro) as 'Outcome',
(SELECT @runningTotal:=0)
from app_fd_trades
where c_CDate>0
GROUP BY YEAR(c_CDate), MONTH(c_CDate)) Totalsand the chart looks like this

 Add your comment...
 - 10-1
Overview
Content Tools
search
attachments
weblink
advanced
I am using this Statement for creating a line graph, but graph has no value:
SET @runningTotal = 0;
SELECT
Date,
@runningTotal := @runningTotal + totals.Outcome AS runningTotal
FROM
(Select CONCAT(MONTH(c_CDate),' ',YEAR(c_CDate))as Date,
sum(c_OutCome) as 'Outcome'
from app_fd_trades1
where c_CDate>0
GROUP BY YEAR(c_CDate), MONTH(c_CDate)) Totals
Here is the results of the query in default database:
Any idea on how to fix this?