...
In the report, you can find aggregated/compiled figures on your processes/activities.

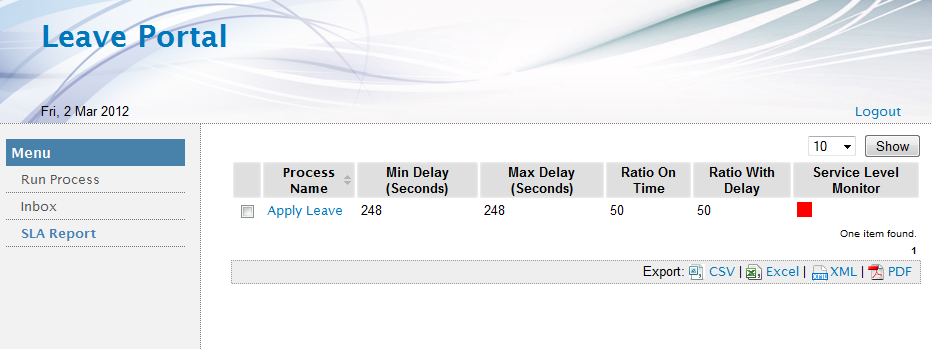
Figure 2: SLA Report - Process View
Process Name: Process name that have SLA implemented.
Min Delay (Seconds): The least delay in seconds for processes/activities that are overdue.
Max Delay (Seconds):The most delay in seconds for processes/activities that are overdue.
Ratio On Time: Percentage of processes completed within the SLA.
Ratio With Delay: Percentage of processes overdue.
Service Level Monitor: SLA Indicator based on the ratio above.
...
SLA report is also available at activity level as well.
In the example above, we can tell that there are 50% of process instances of Leave Application Process are completed on time with the other half not. For instance that are delayed, the worst case being delayed for 248 seconds and the least is 200 seconds.


Figure 3: SLA Report - Activity View
In the example above, we can tell that half of the Apply Leave activities are completed in time and all Approve Leave activities are completed in time.