...
- Log in as an administrator
- Open up the Administrator Bar
- Click on Monitor
- Click on Performance
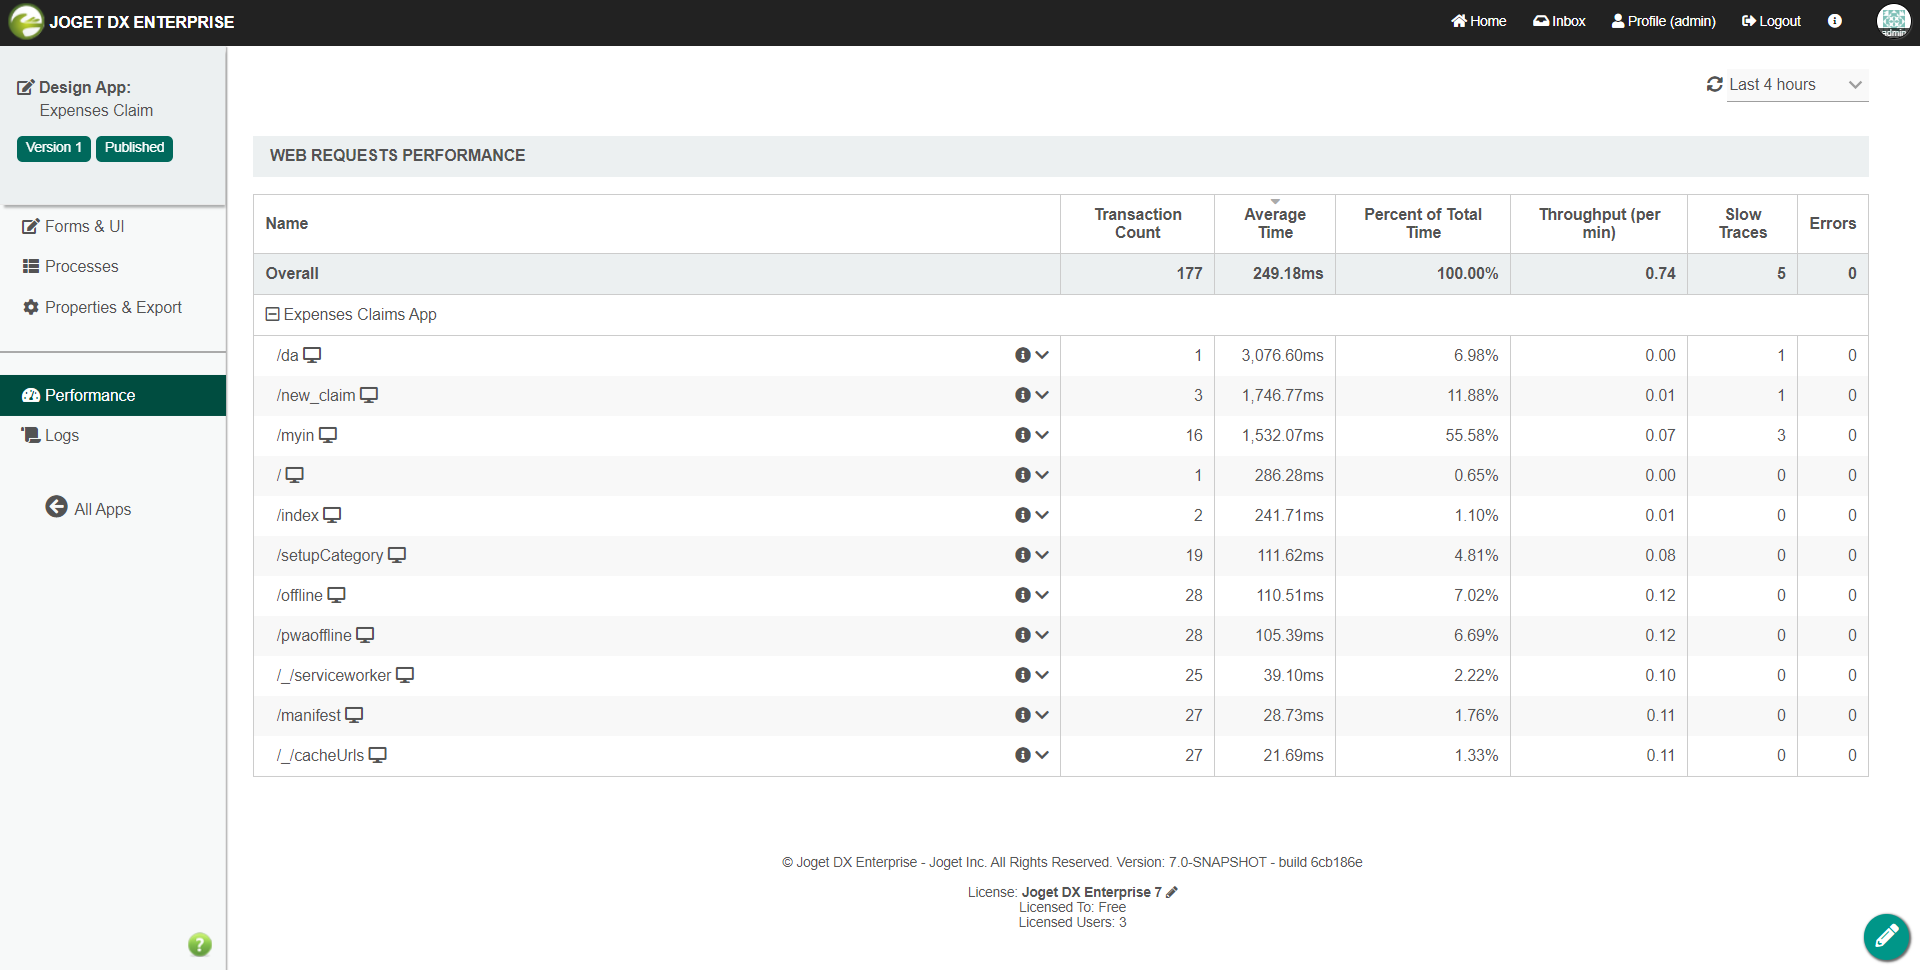
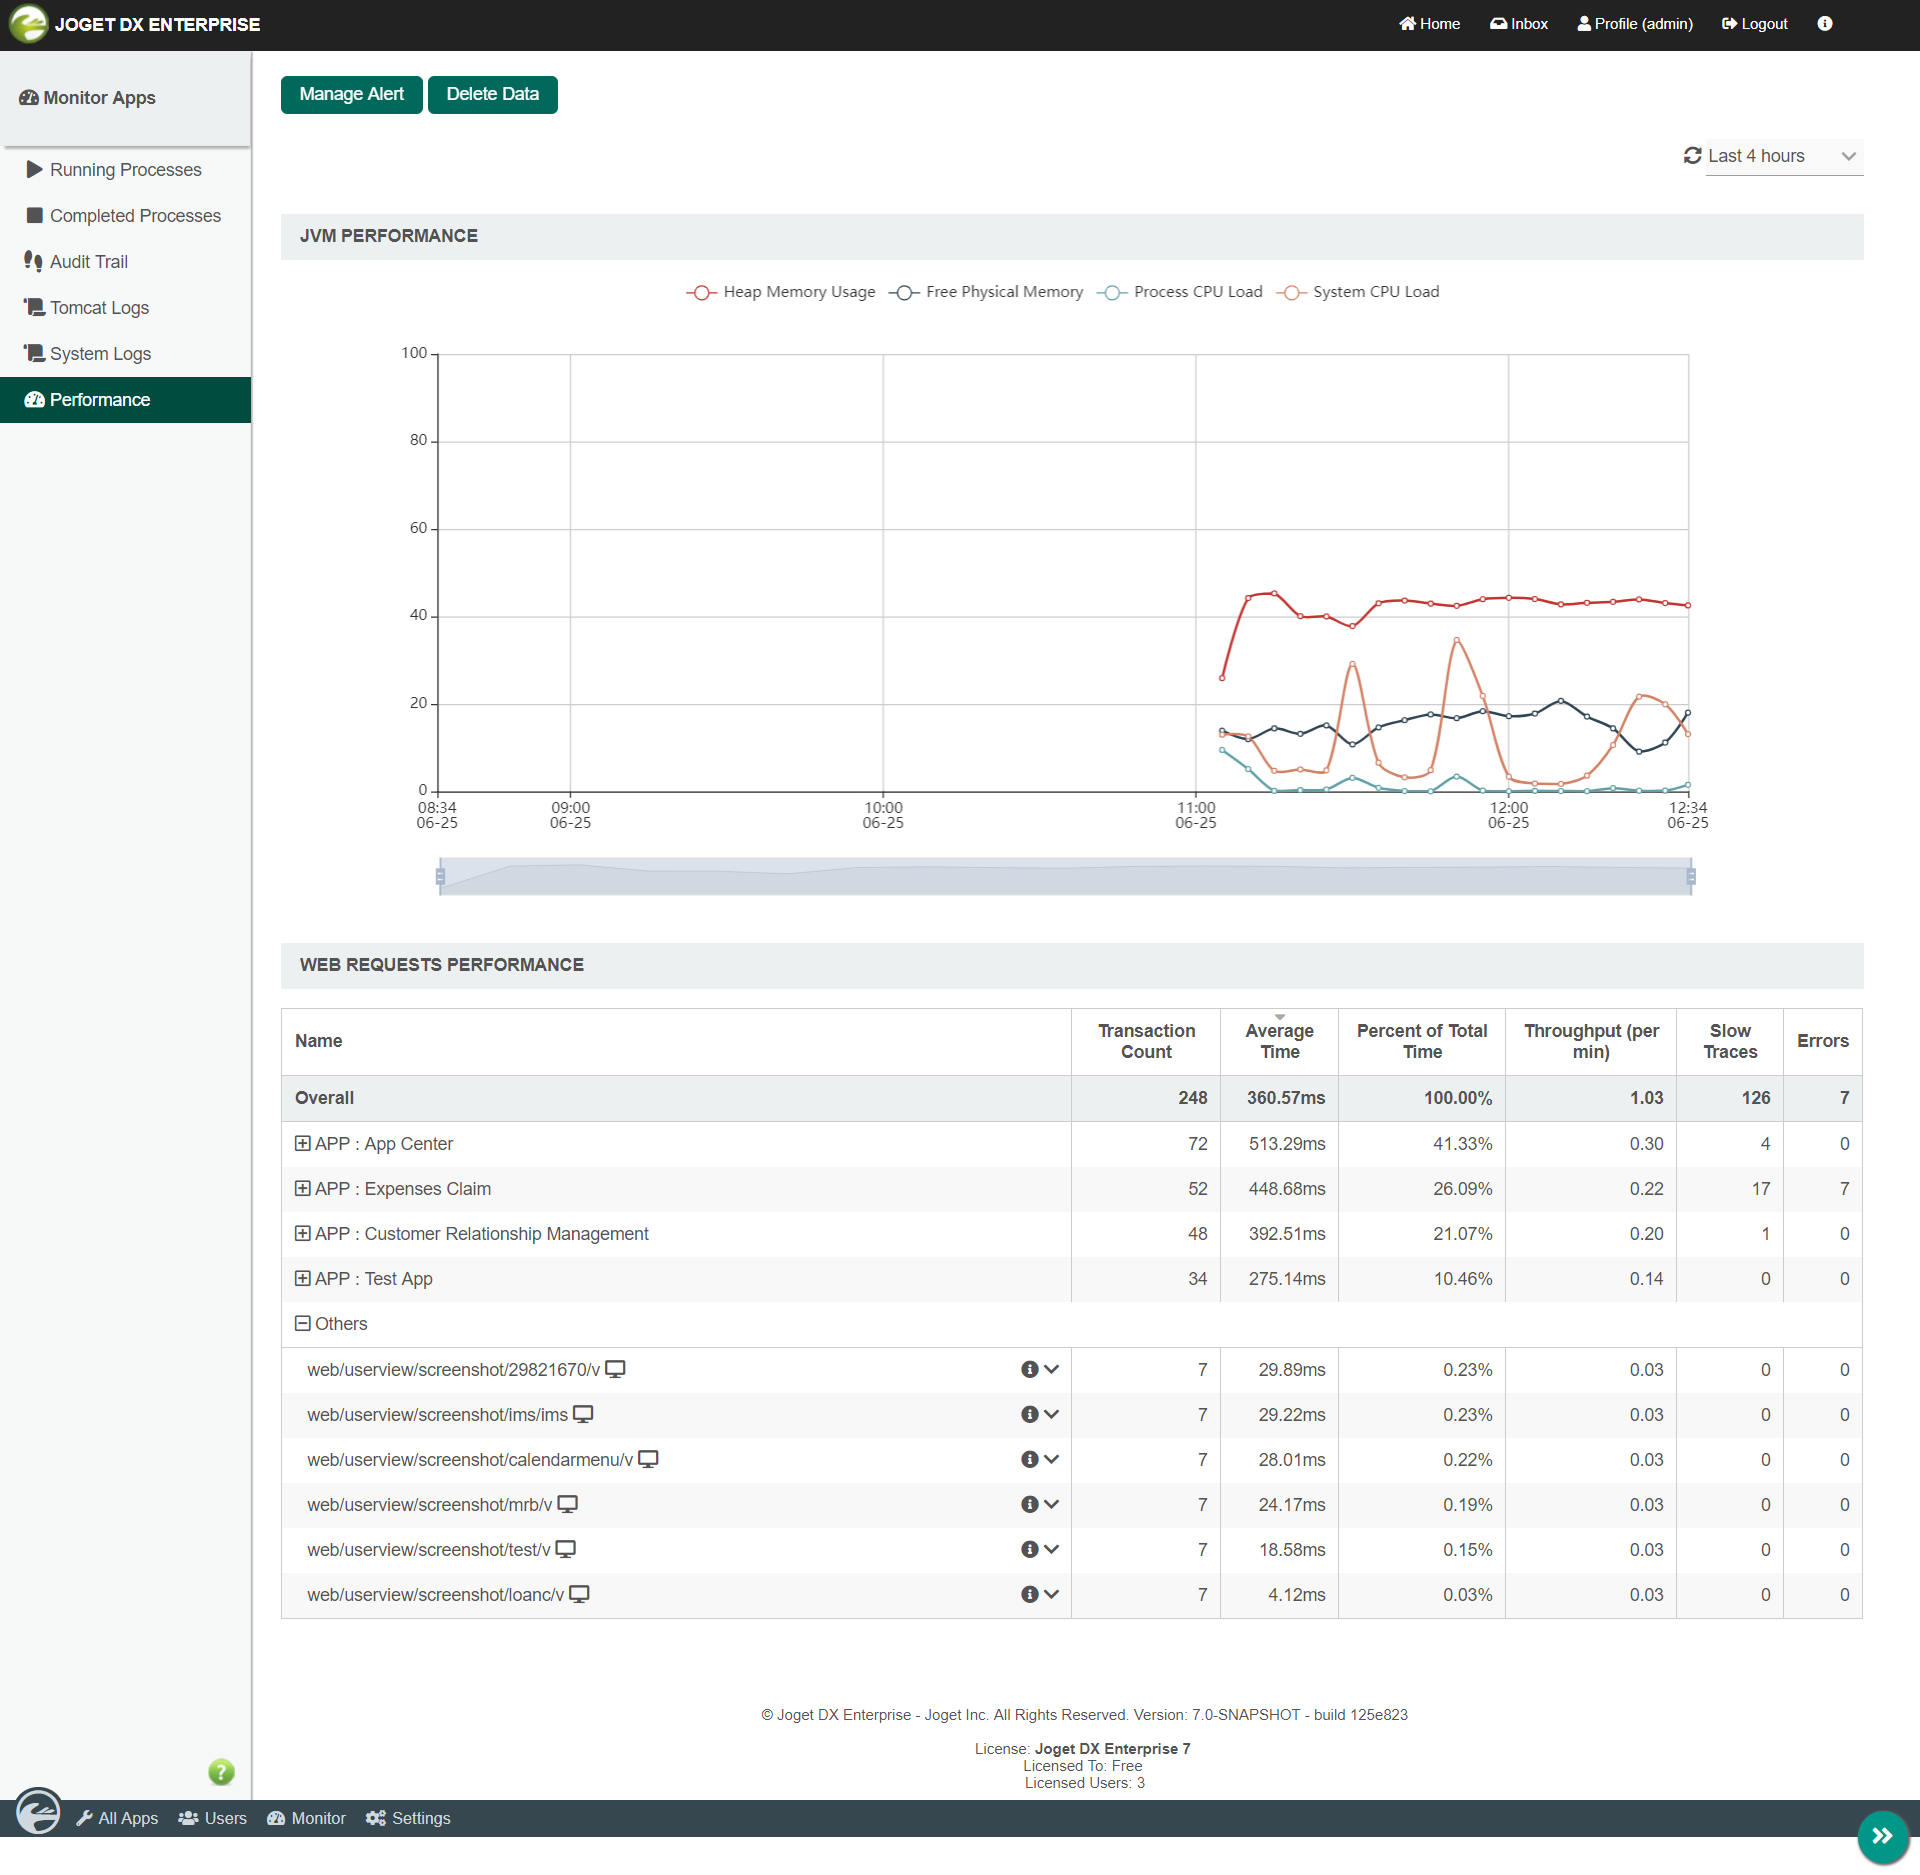
Figure 1 : Sample APM in Monitor Apps > Performance.
...
- Log in as administrator
- Hover on an app until a pencil icon is displayed
- Click on the pencil icon to access to the Design App
- Click on Performance
Figure 2 : Sample APM in the Performance menu under a sample App entitled "Expenses Claim". This will display performance information related only to the current App.
Web Request Performance
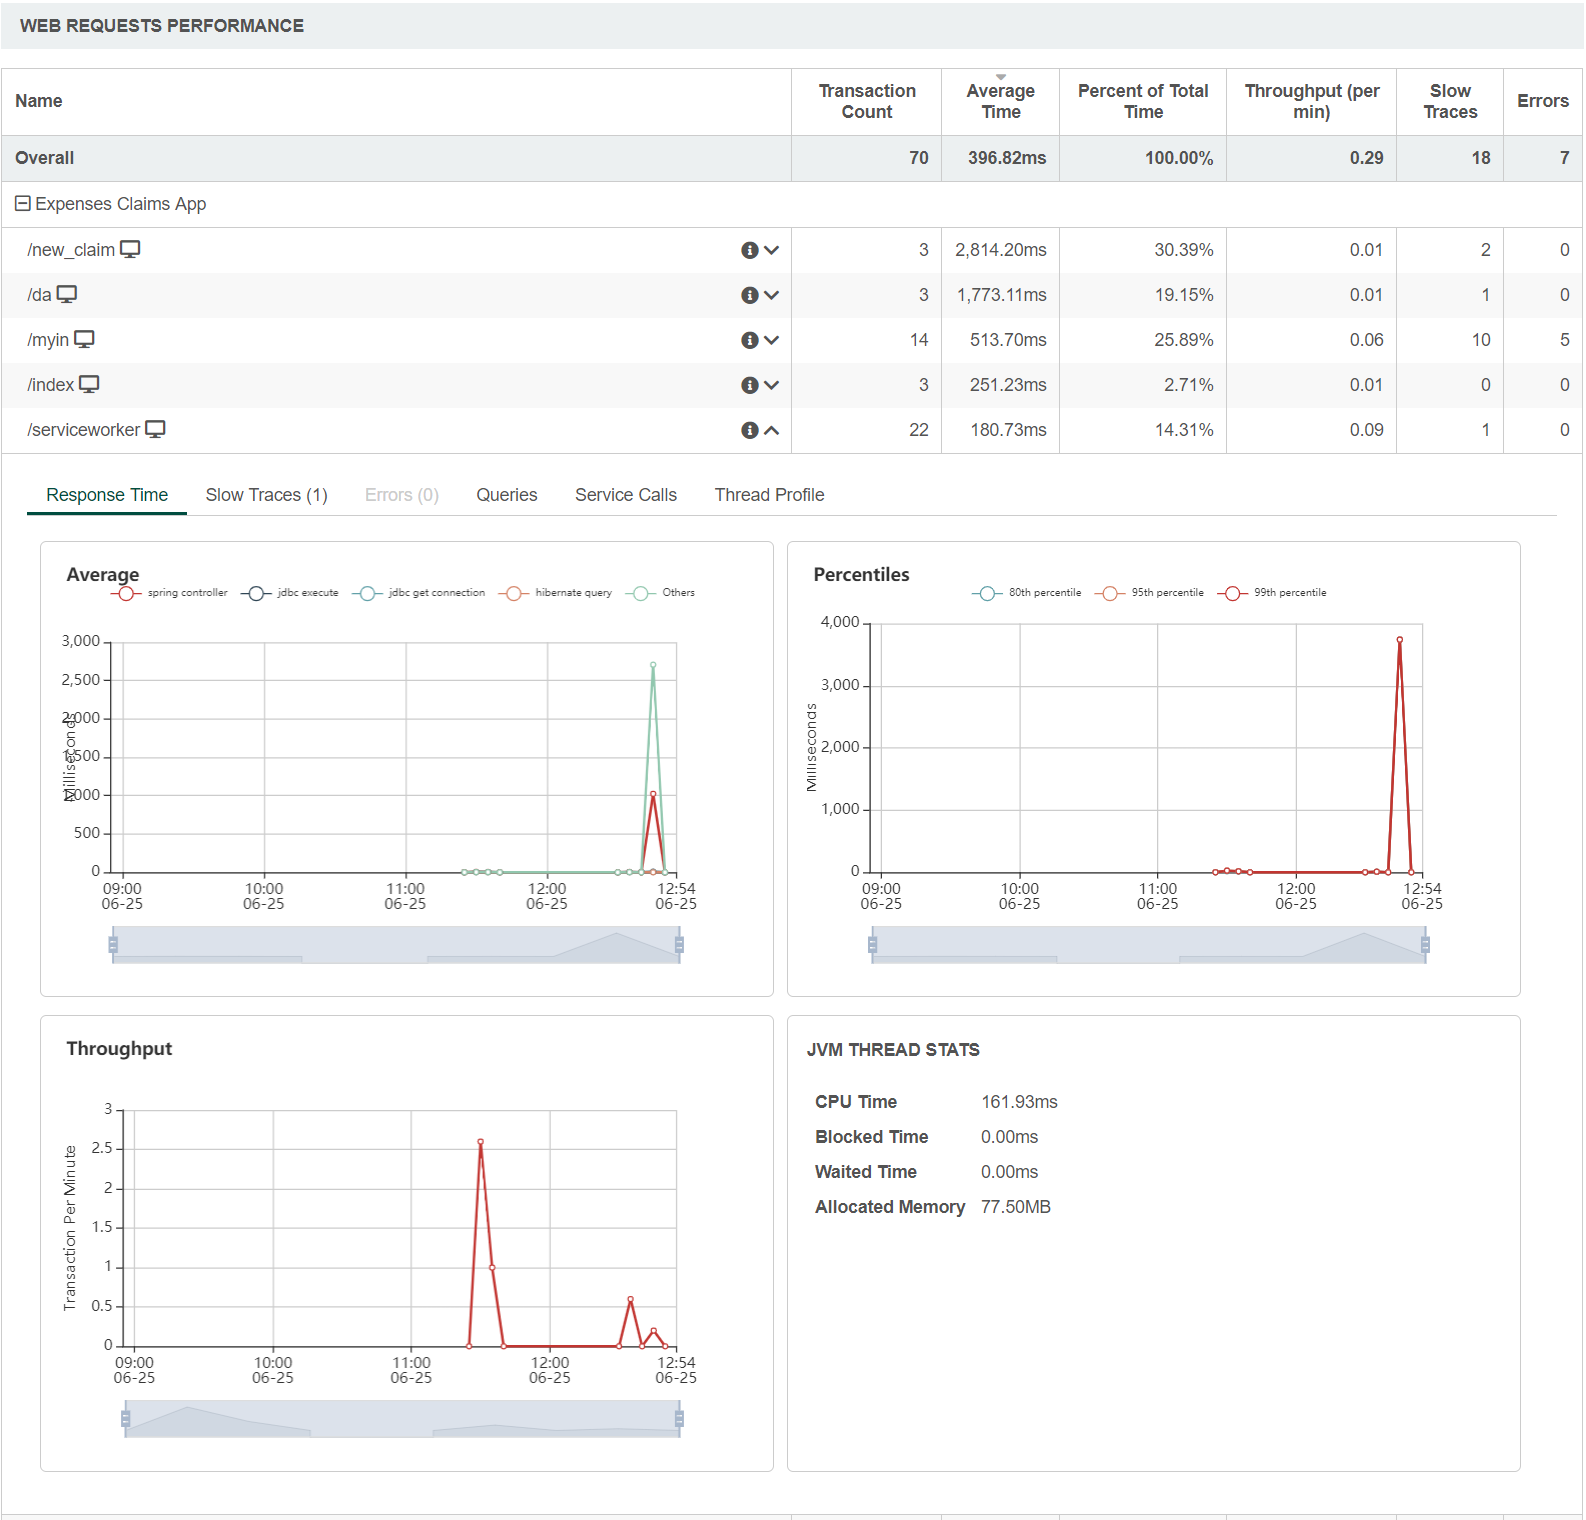
Figure 3 : Web Requests Performance - Response Time

Figure 4 : Web Requests Performance - Slow Traces
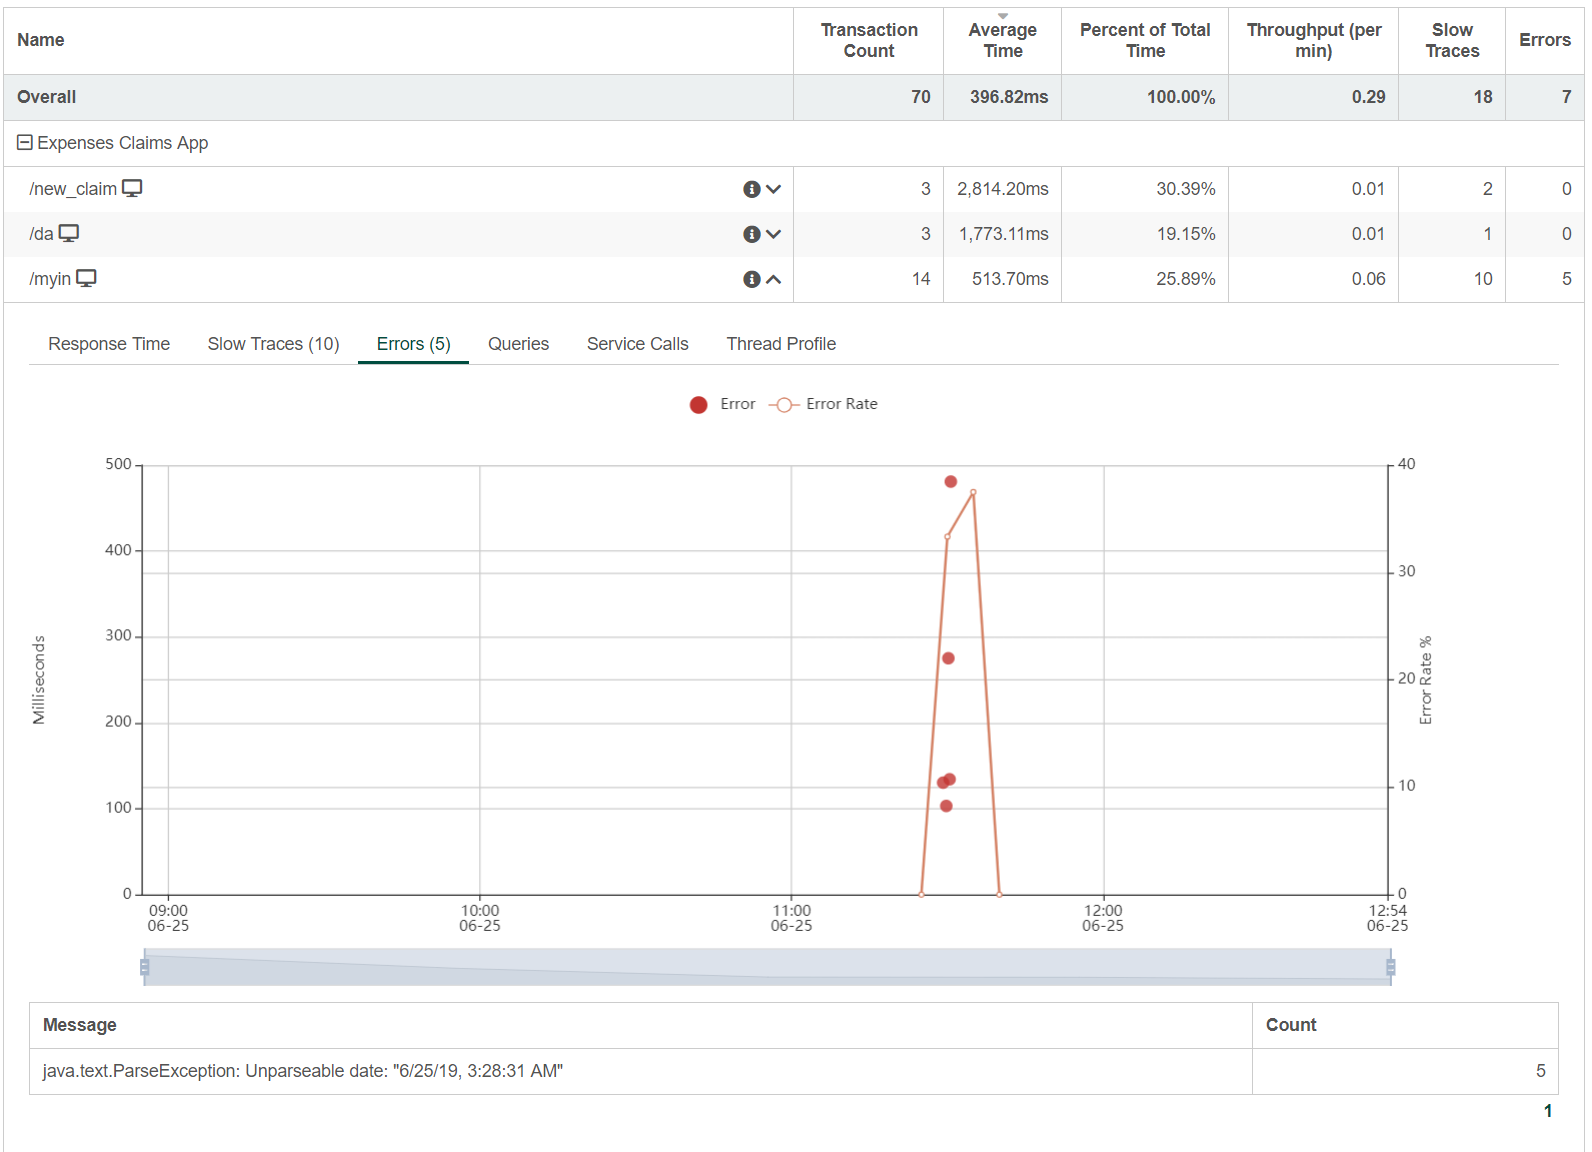
Figure 5 : Web Requests Performance - Errors
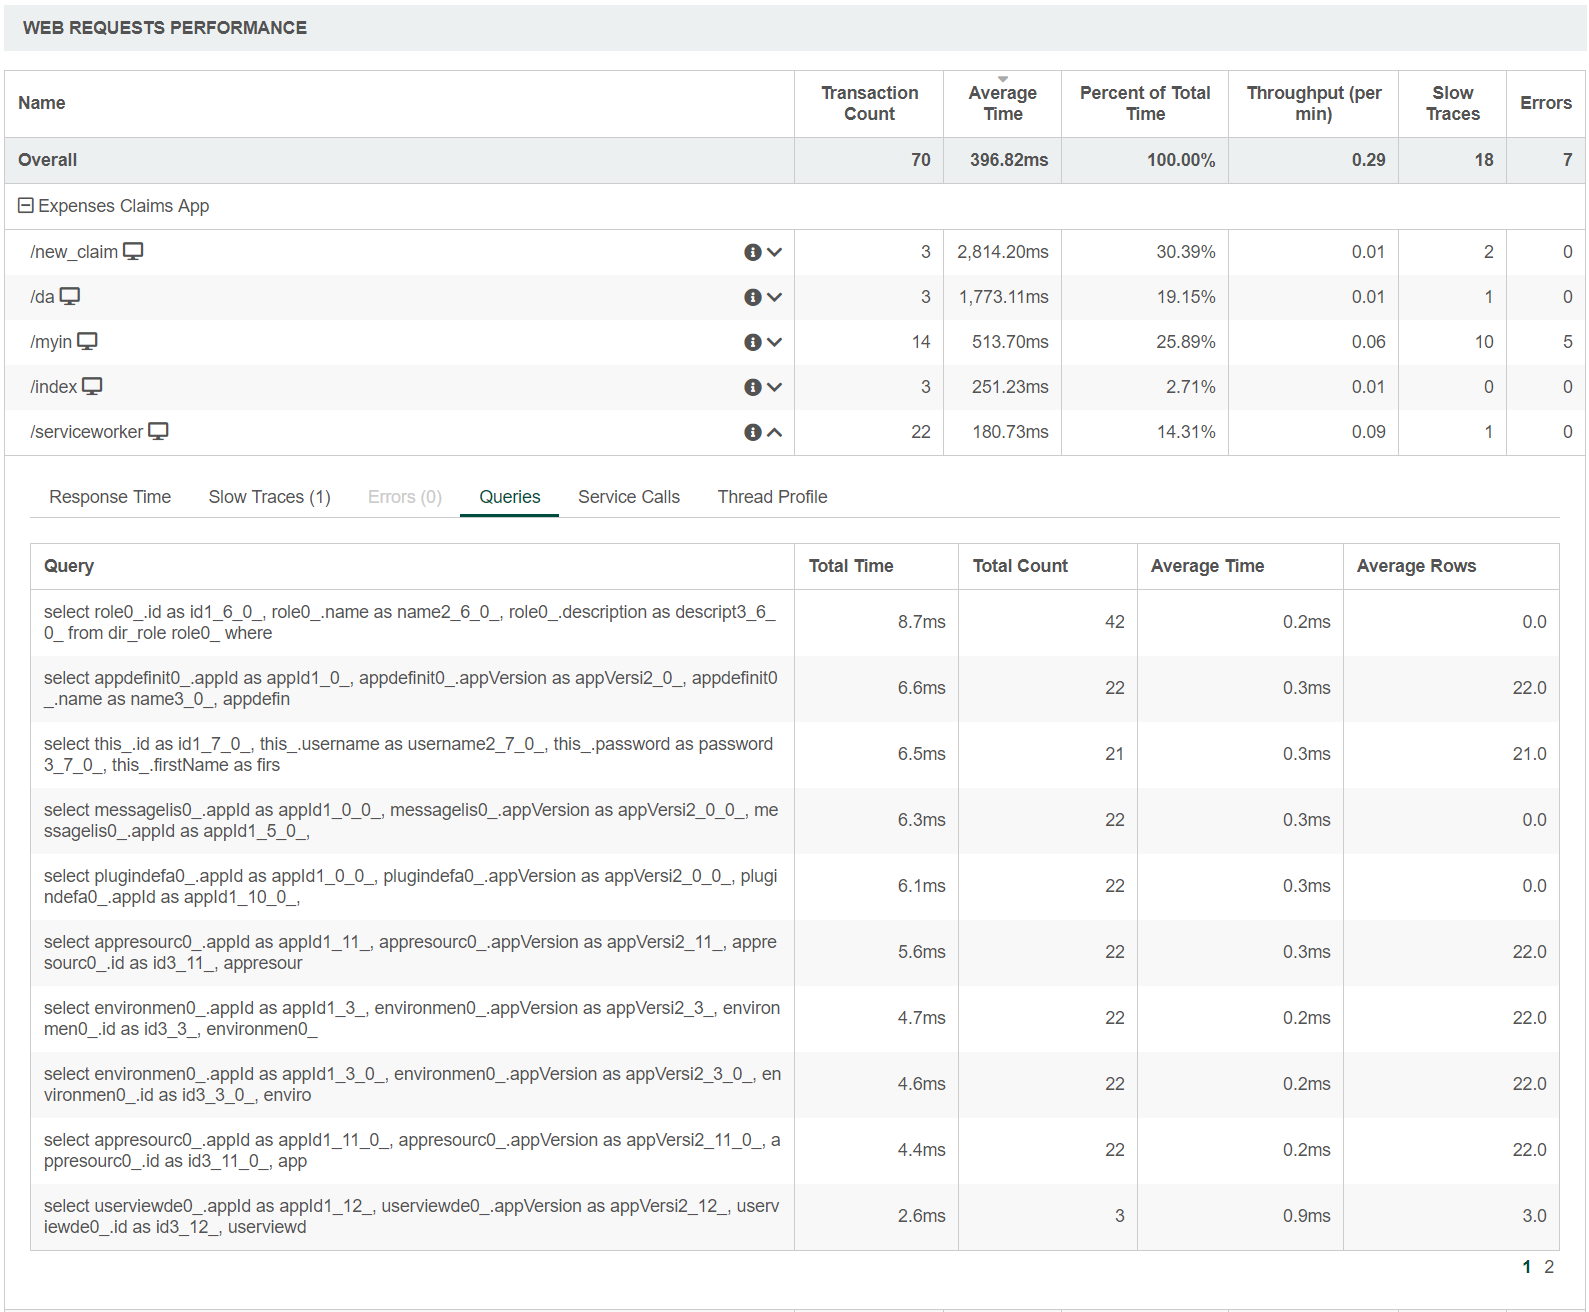
Figure 6 : Web Requests Performance - Errors
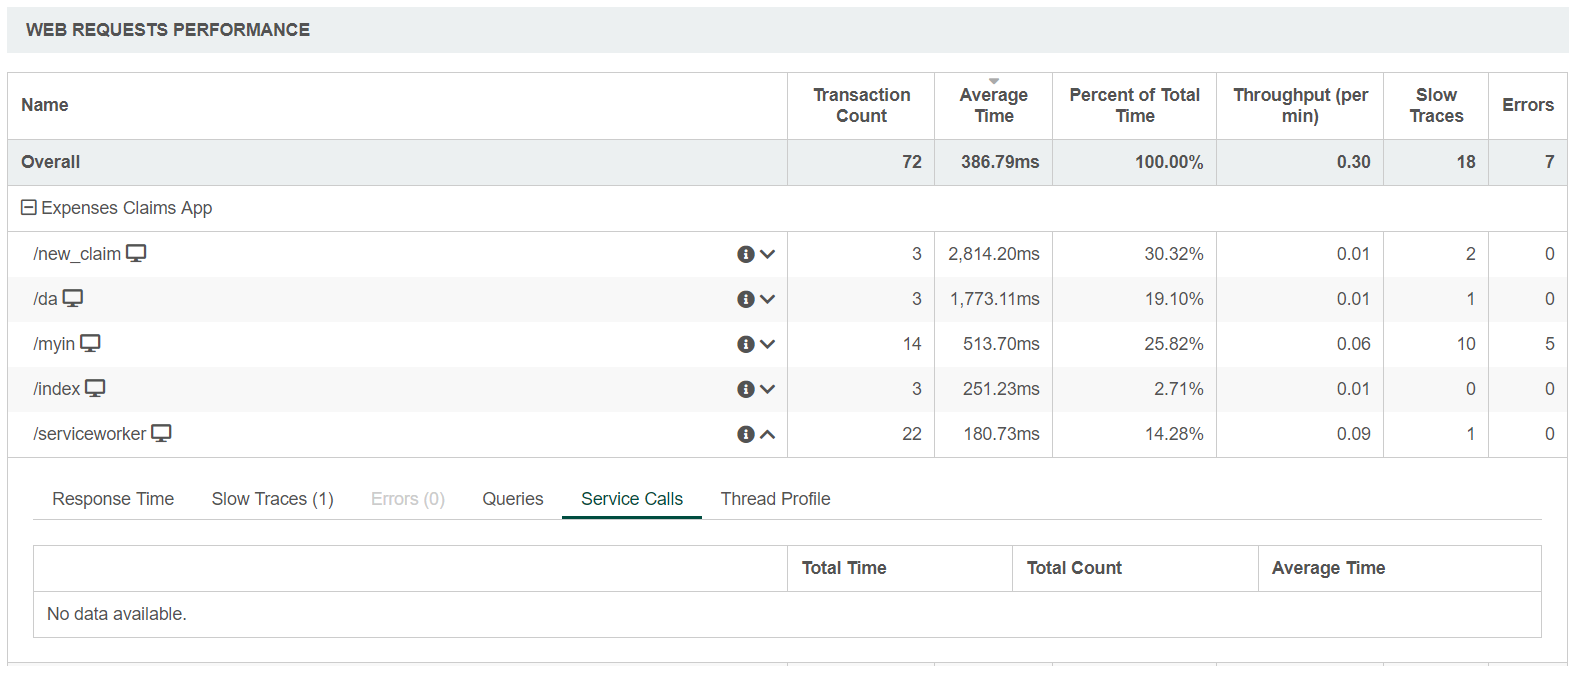
Figure 7 : Web Requests Performance - Service Calls
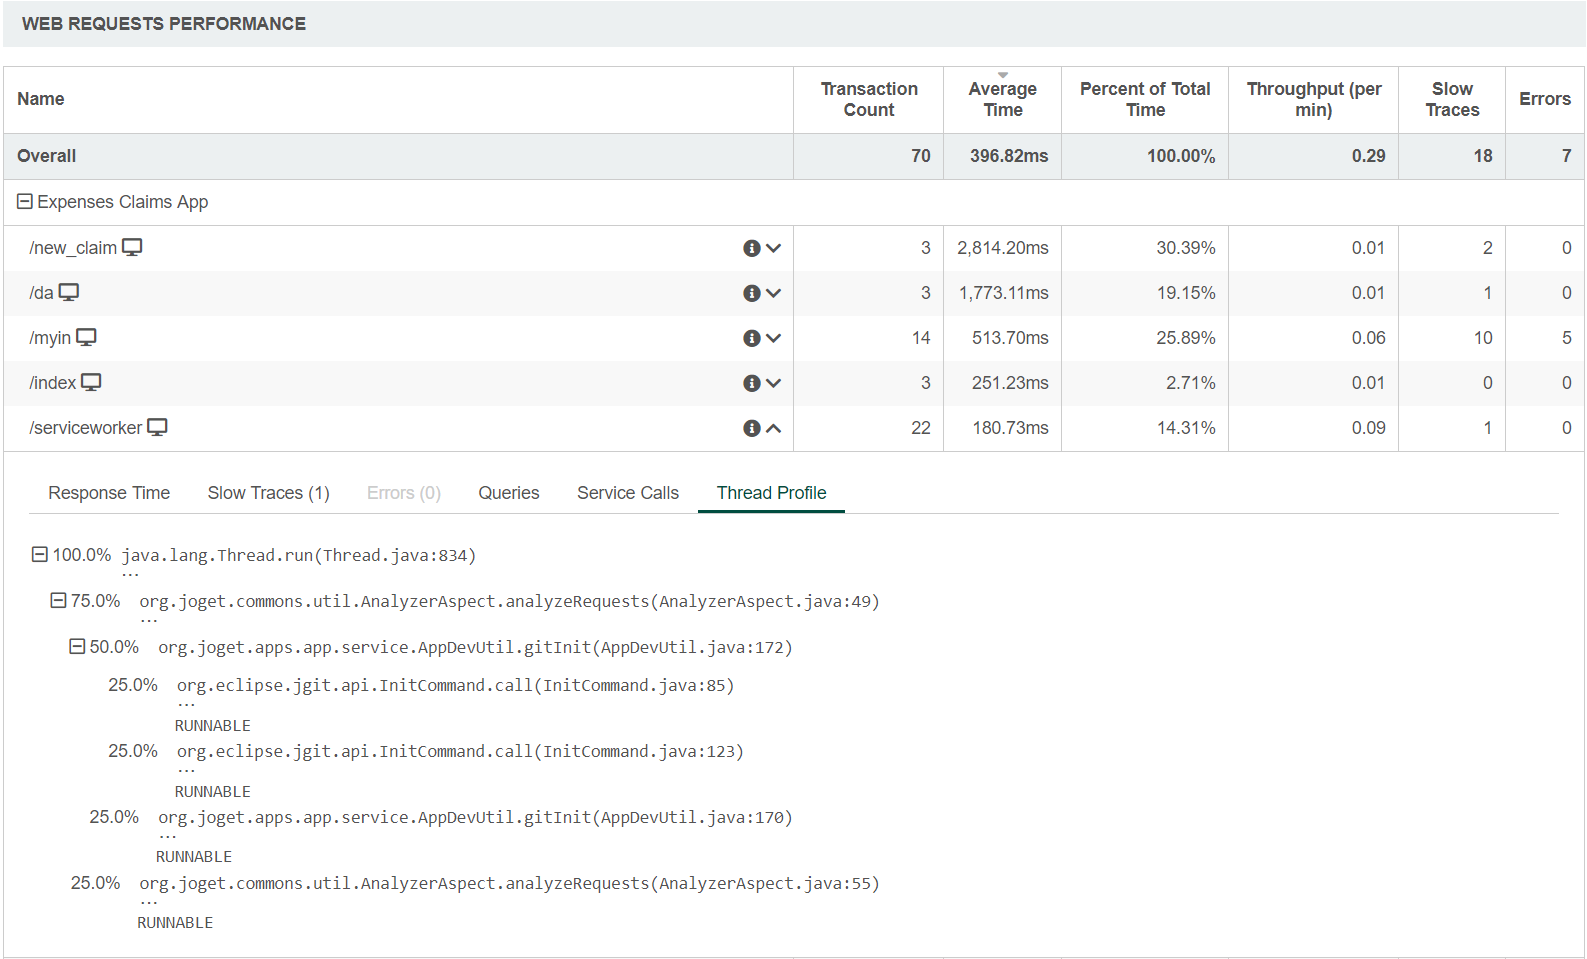
Figure 8 : Web Requests Performance - Thread Profile
Manage Alert
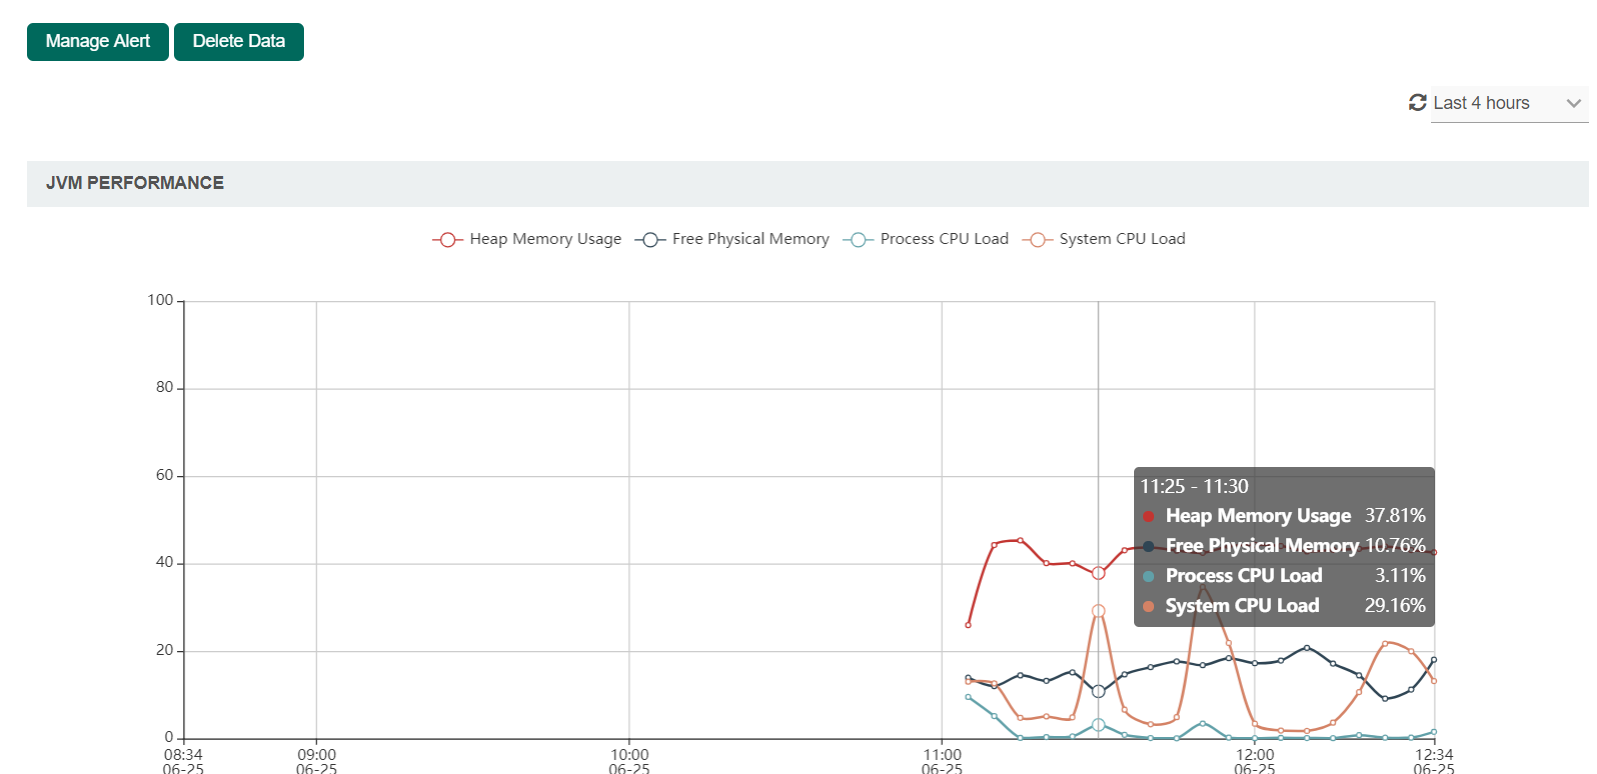
Figure 9 : Application Performance Management (APM) properties
| Name | Description | |||||
|---|---|---|---|---|---|---|
| Manage Alert | Set up an email Performance Alert notification.
| |||||
| Delete Data | A prompt will be displayed to confirm deletion of performance data.
| |||||
|
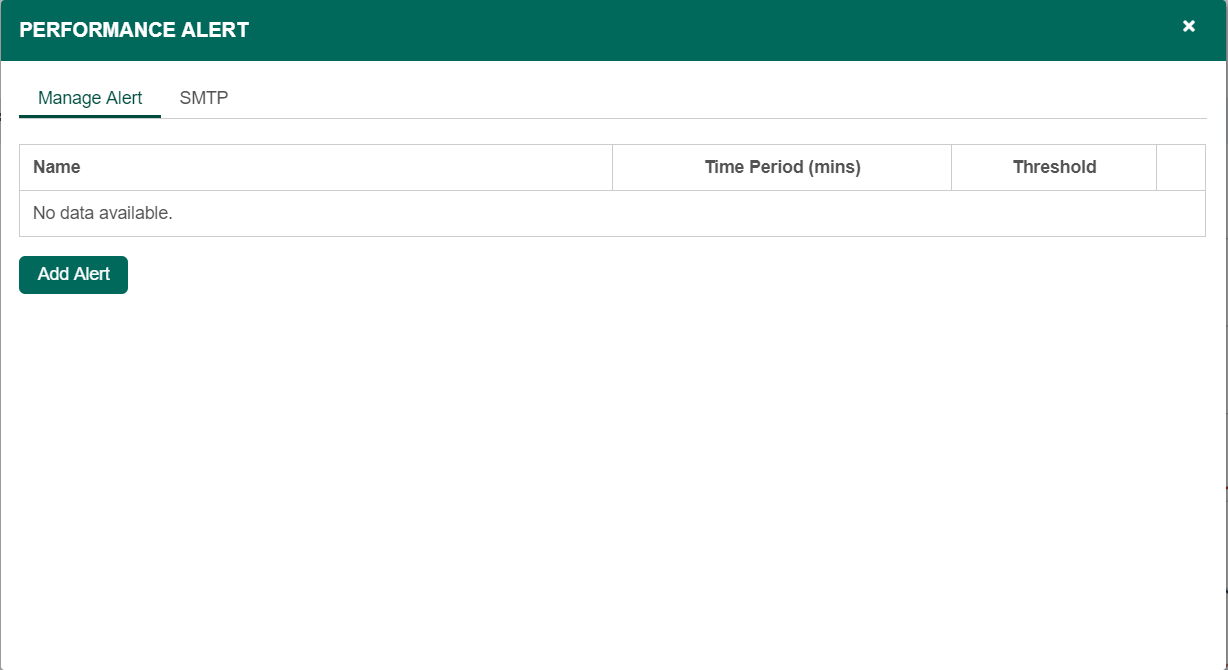
Figure 10 : Performance Alert - Manage Alert
| Name | Description |
|---|---|
| Add Alert | Setup an alert |
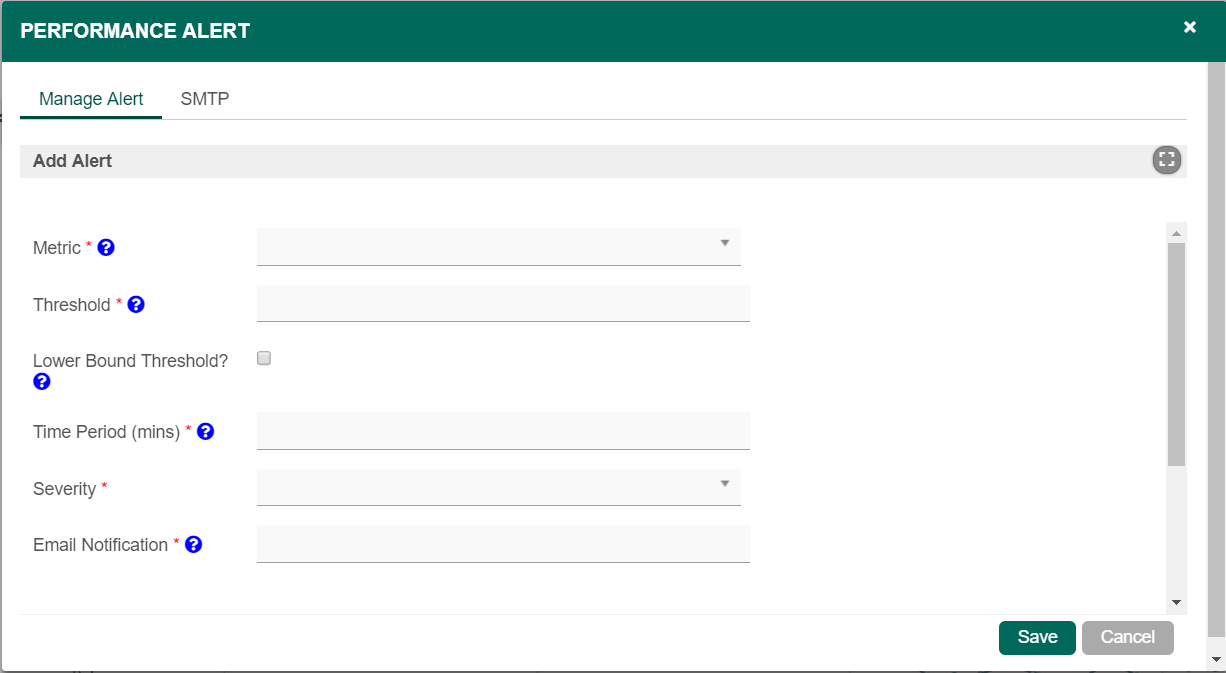
Figure 11 : Performance Alert - Manage Alert - Add Alert
...
| Name | Description | |||||
|---|---|---|---|---|---|---|
| Metric | The metric that this alert monitors. Available Metrics:
| |||||
| Threshold | If the metric value over the given time period is greater than or equal to this threshold, then alert will be triggered | |||||
| Lower Bound Threshold? | Alert if the metric value is less than or equal to the threshold, instead of alerting if it is greater than or equal to the threshold. | |||||
| Time Period (mins) | The time period over which the metric is calculated. | |||||
| Minimum Transaction Count | Time periods with very few transactions have much less meaningful metrics, so this can be used to suppress alerts from being generated unless the time period has a minimum transaction count.
| |||||
| Severity |
| |||||
| Email Notification | Comma separated list of email addresses. |
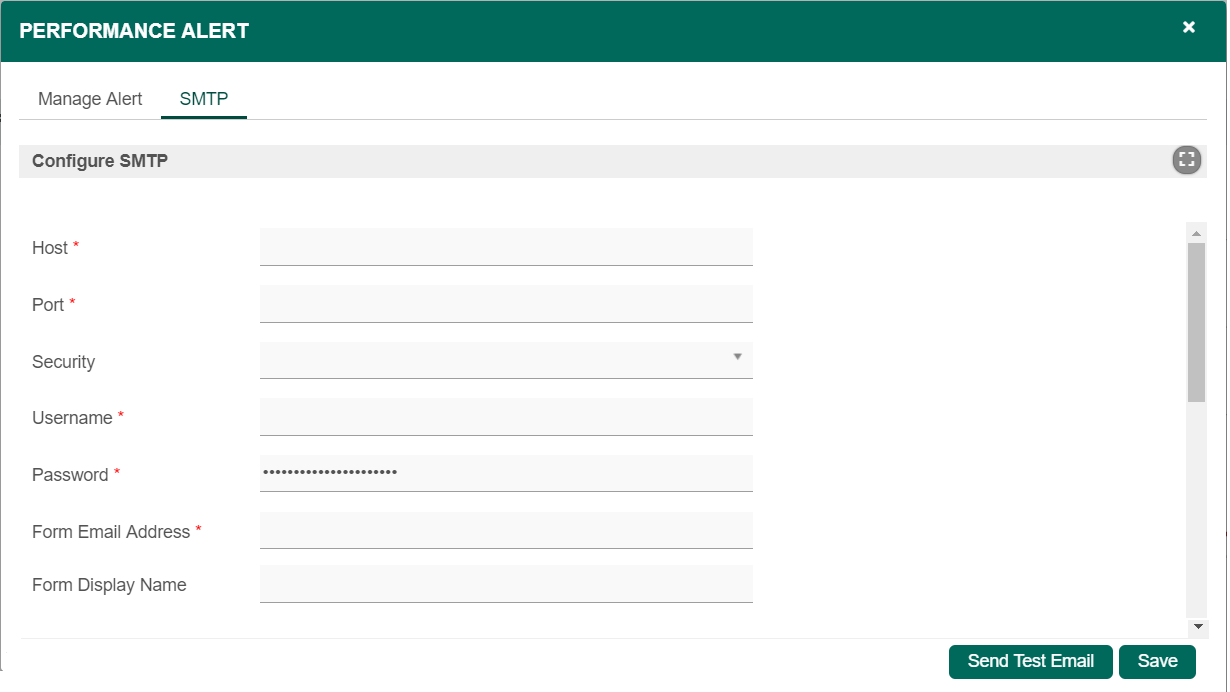
Figure 12 : Performance Alert - SMTP Settings
...