Application Performance Management (APM) is a built-in feature that automatically monitors system and application performance. The monitoring is done at runtime, and alerts can be configured for various metrics including errors, so that email notifications are sent when thresholds are exceeded.
This is a new feature in Joget DX Enterprise Edition
How do I access to the System APM?
- Log in as an administrator
- Open up the Administrator Bar
- Click on Monitor
- Click on Performance
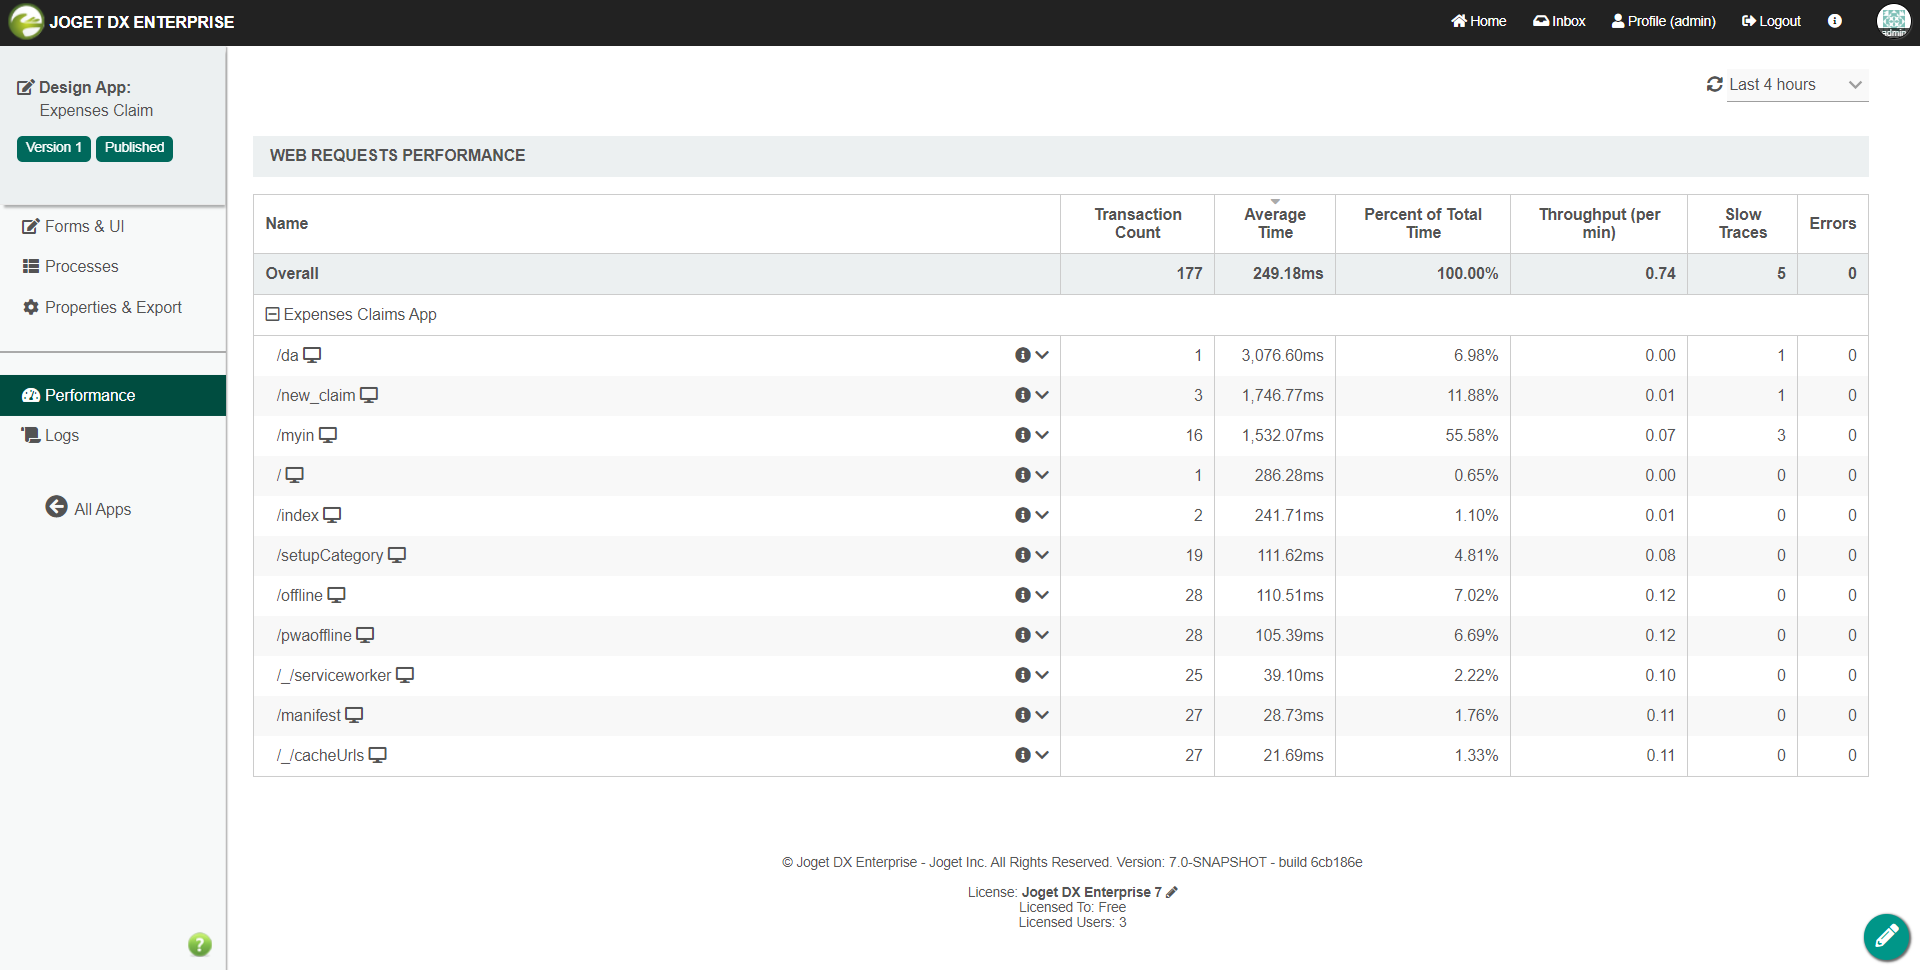
Figure 1 : Sample APM in Monitor Apps > Performance.
How do I access to the APM in my App ?
- Log in as administrator
- Hover on an app until a pencil icon is displayed
- Click on the pencil icon to access to the Design App
- Click on Performance
Figure 2 : Sample APM in the Performance menu under a sample App entitled "Expenses Claim". This will display performance information related only to the current App.
Web Request Performance
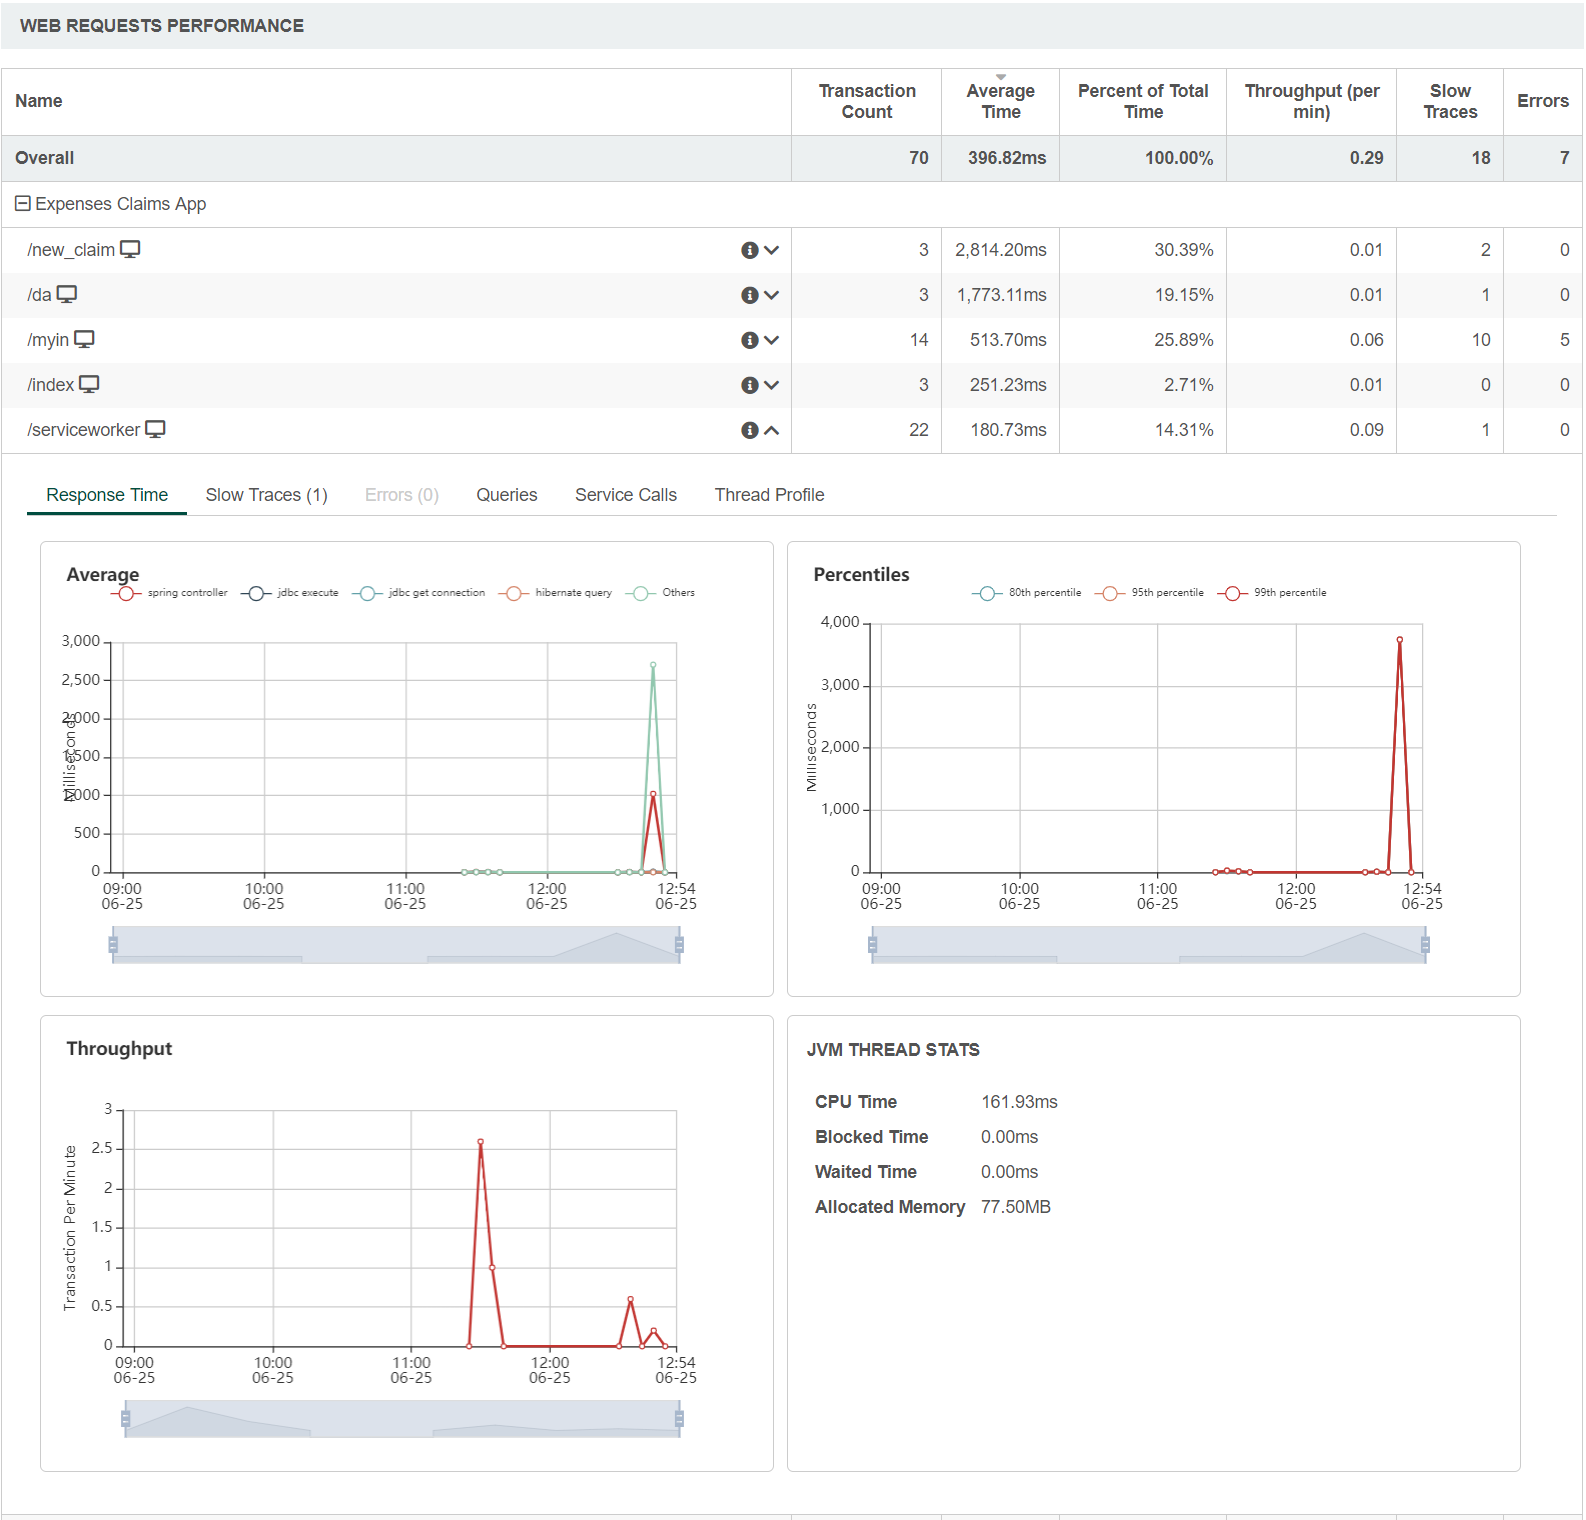
Figure 3 : Web Requests Performance - Response Time

Figure 4 : Web Requests Performance - Slow Traces
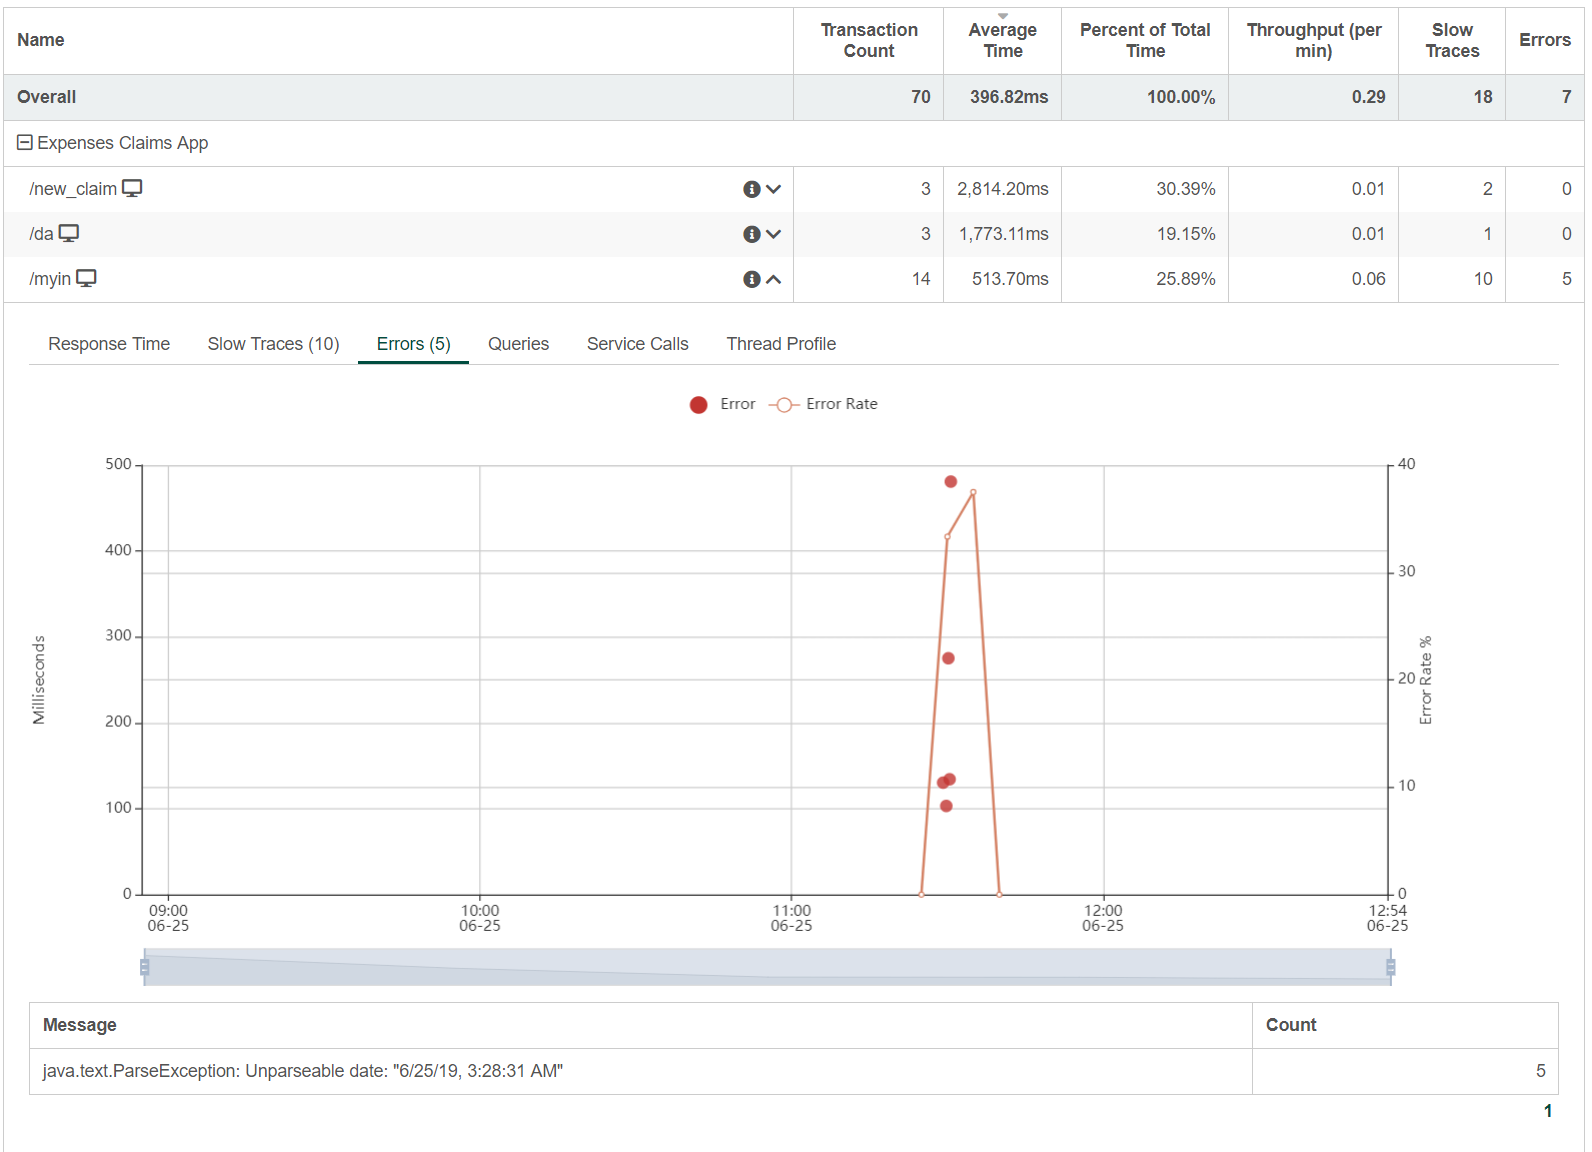
Figure 5 : Web Requests Performance - Errors
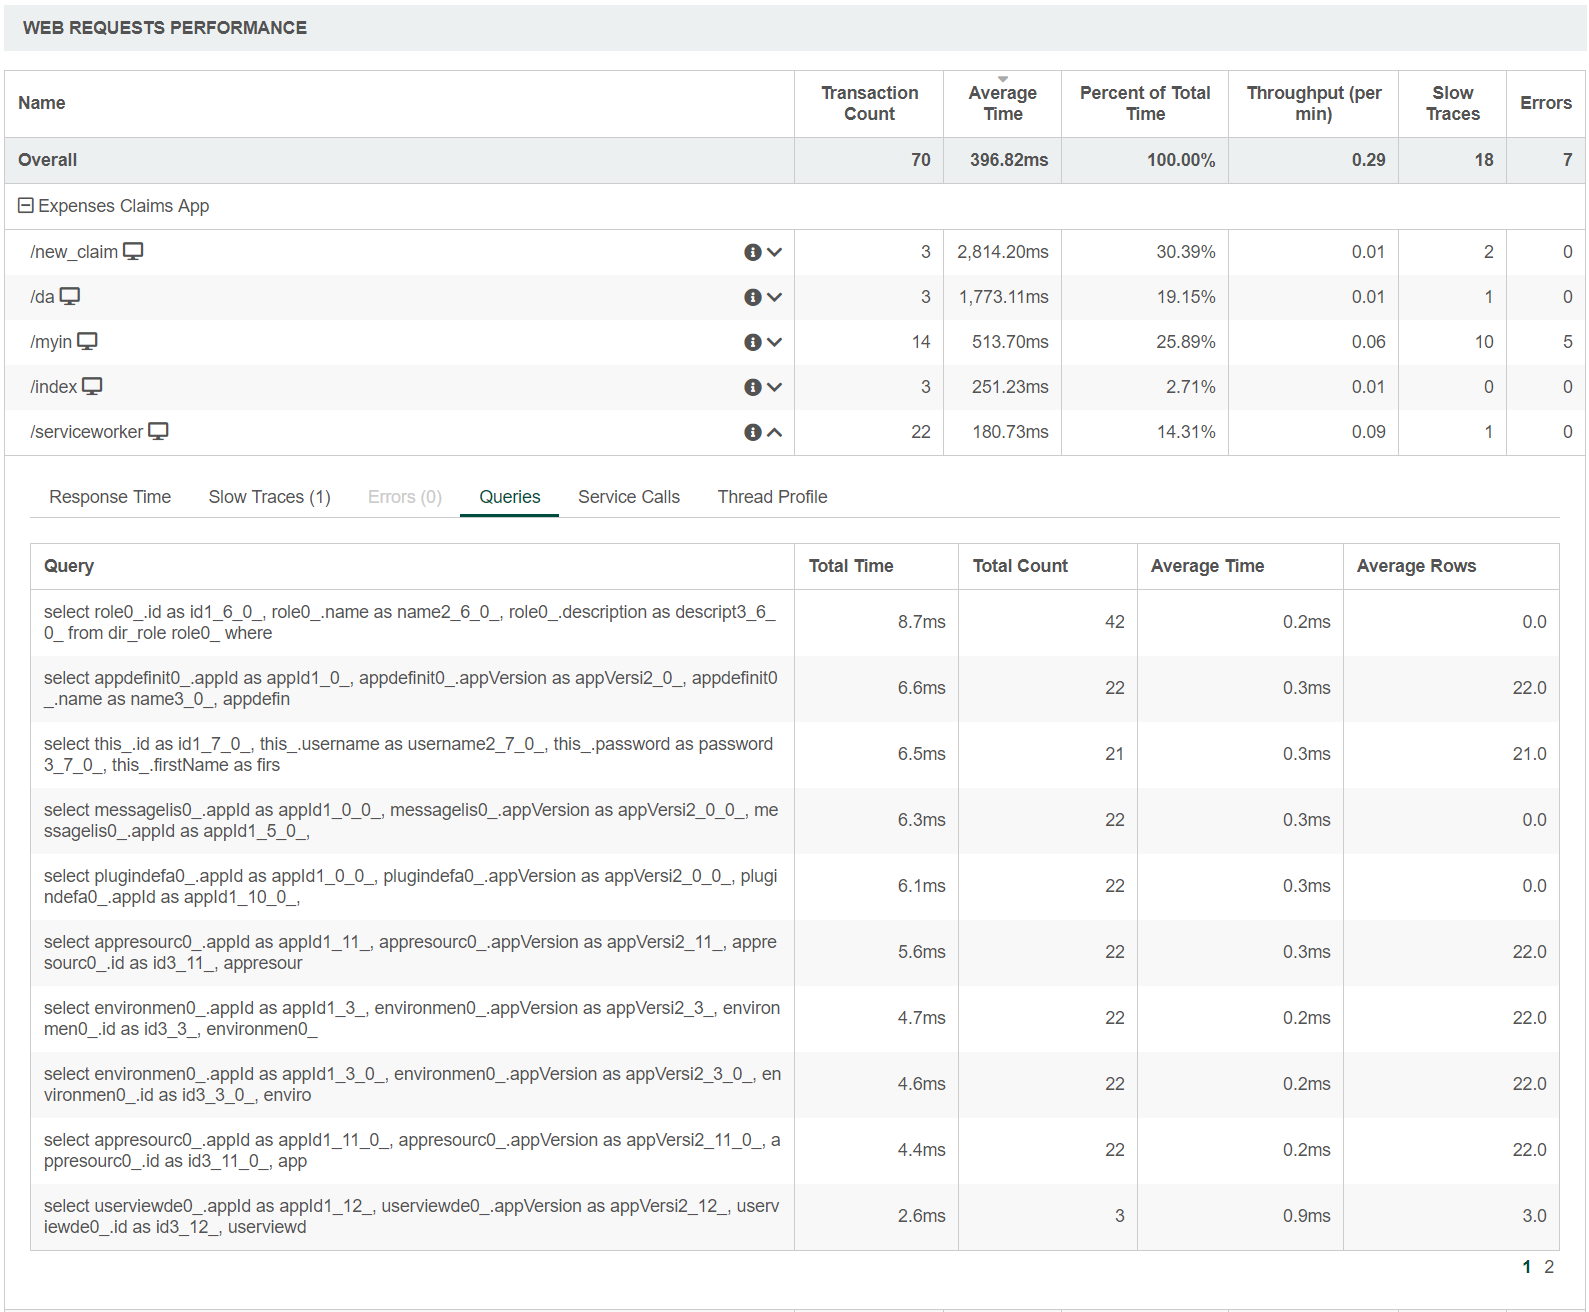
Figure 6 : Web Requests Performance - Errors
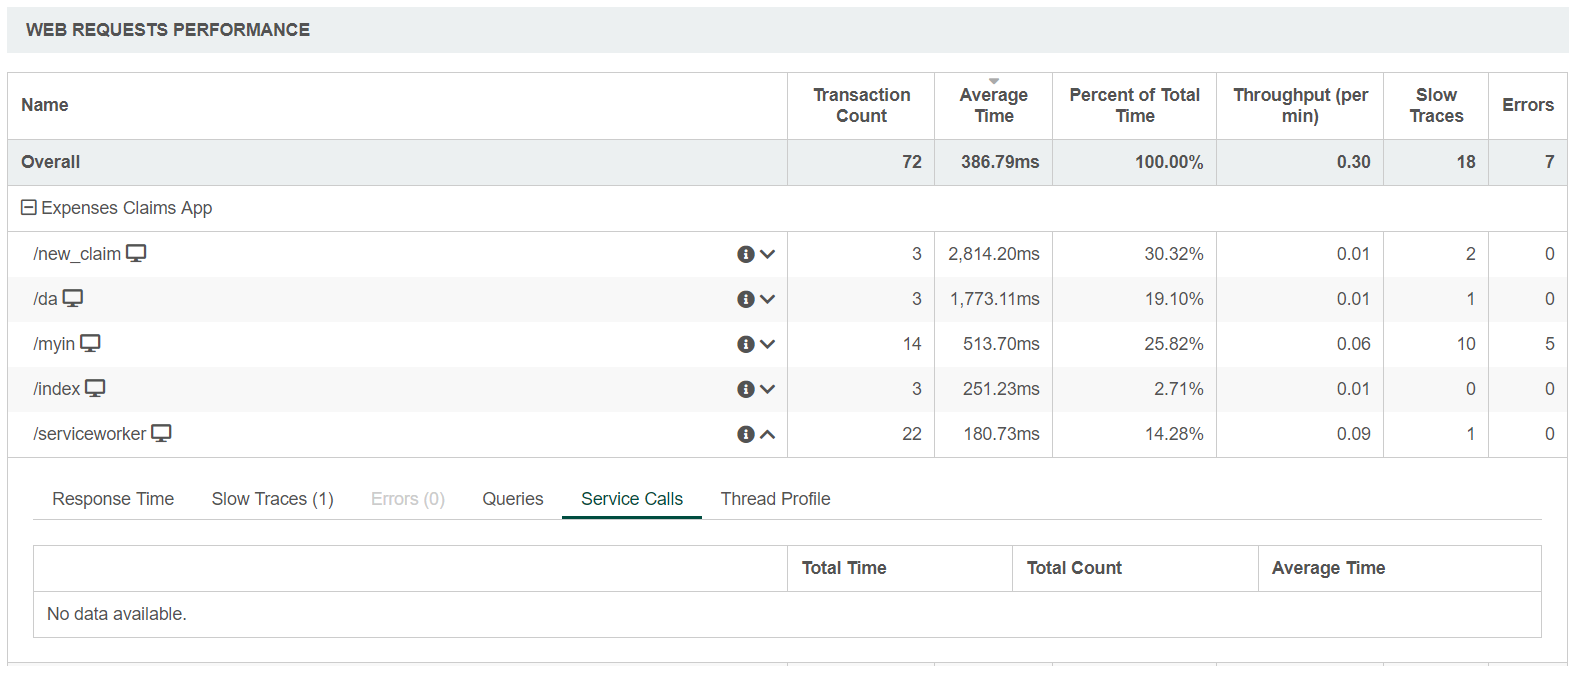
Figure 7 : Web Requests Performance - Service Calls
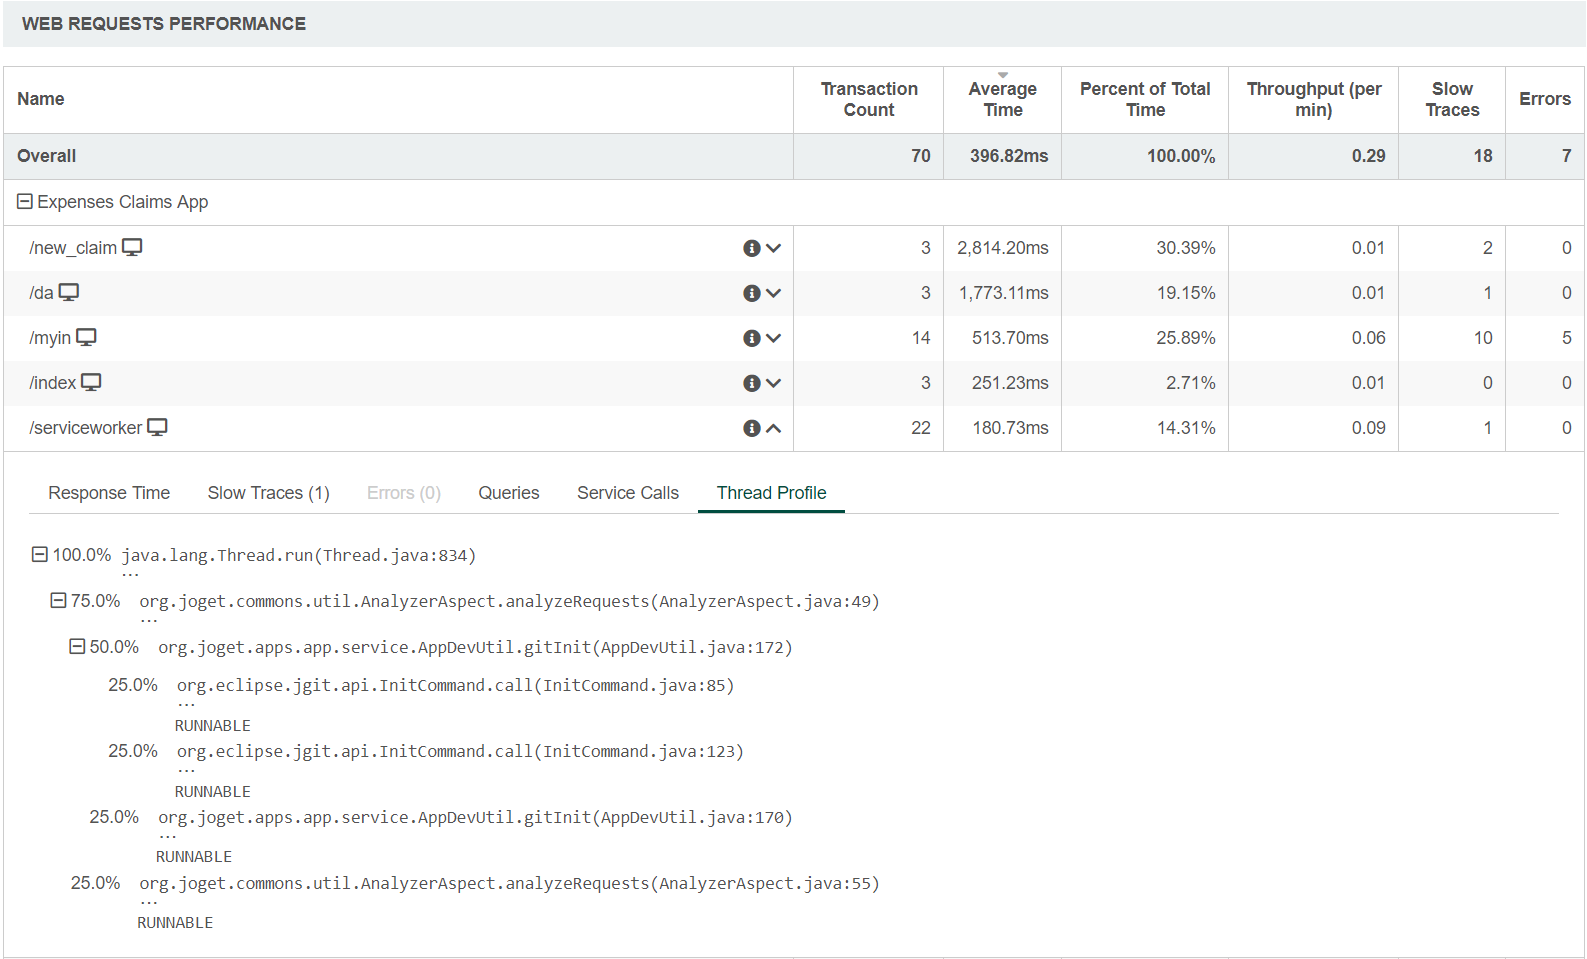
Figure 8 : Web Requests Performance - Thread Profile
Manage Alert
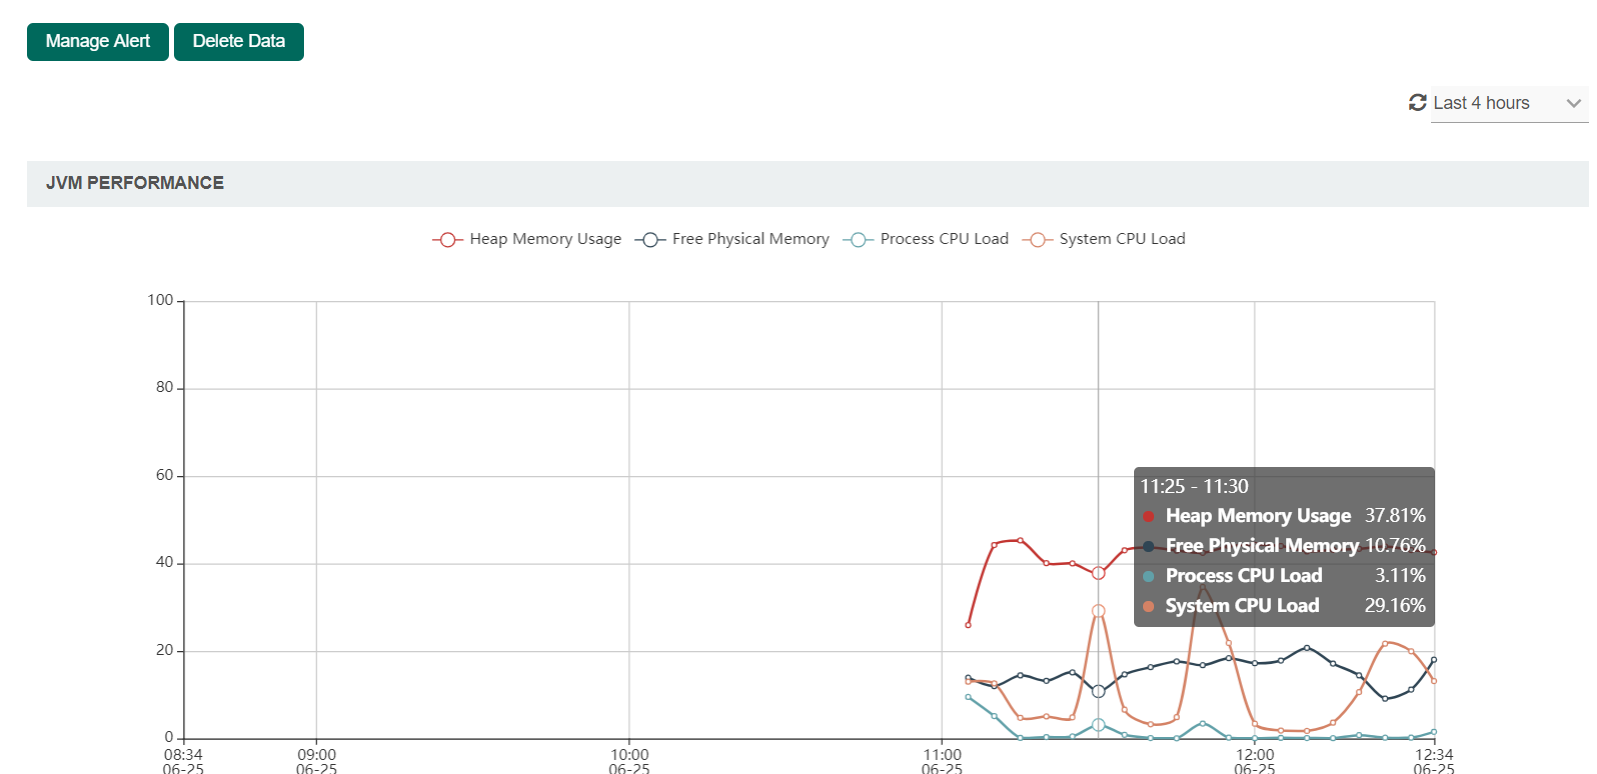
Figure 9 : Application Performance Management (APM) properties
| Name | Description |
|---|---|
| Manage Alert | Set up an email Performance Alert notification. Note This is only available in the System APM under the Monitor > Performance menu. |
| Delete Data | A prompt will be displayed to confirm deletion of performance data. Note This is only available in the System APM under the Monitor > Performance menu. |
|
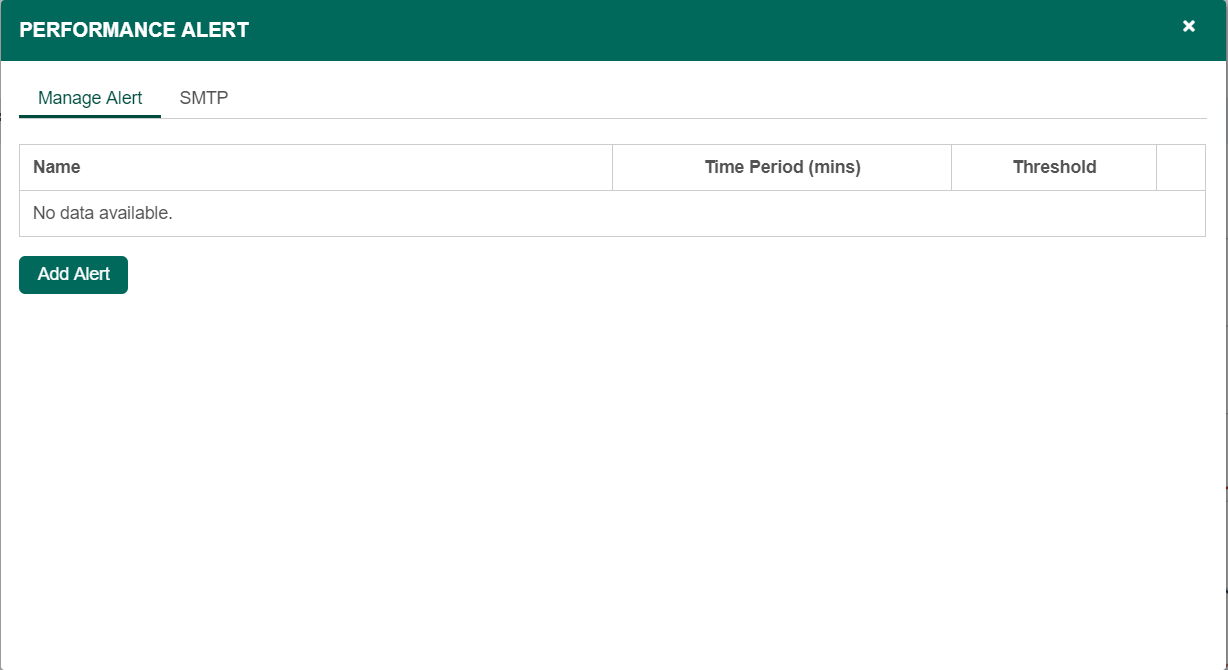
Figure 10 : Performance Alert - Manage Alert
| Name | Description |
|---|---|
| Add Alert | Setup an alert |
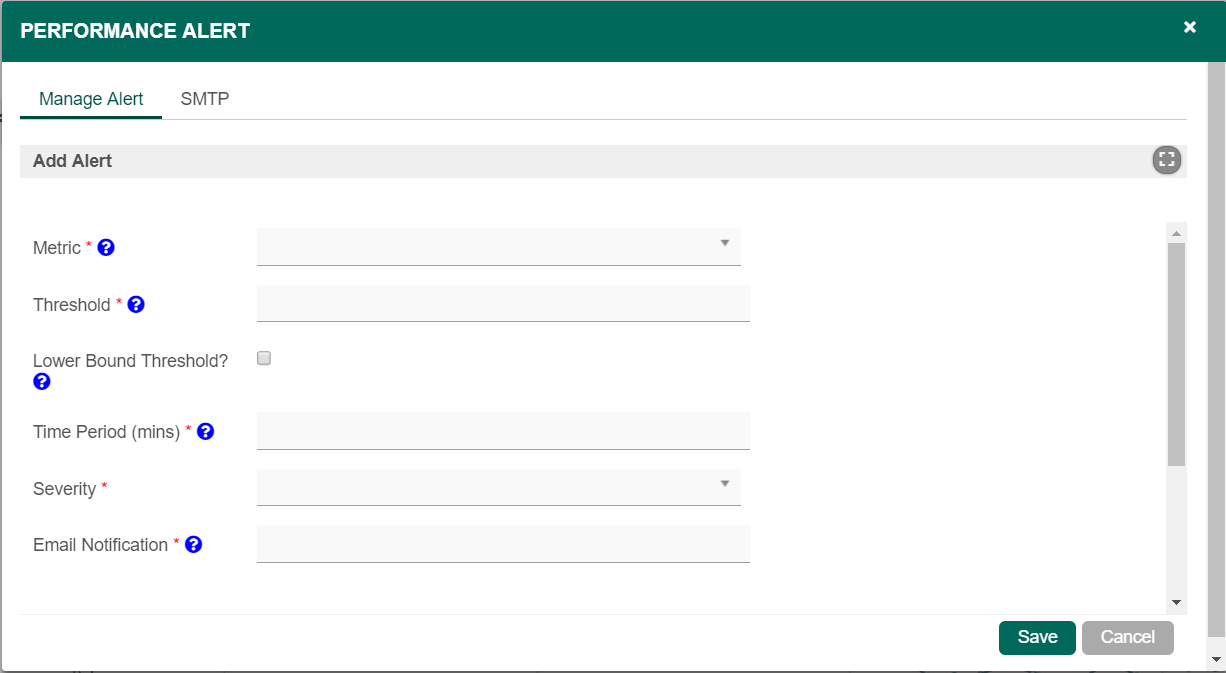
Figure 11 : Performance Alert - Manage Alert - Add Alert
| Name | Description |
|---|---|
| Metric | The metric that this alert monitors. Available Metrics:
|
| Threshold | If the metric value over the given time period is greater than or equal to this threshold, then alert will be triggered |
| Lower Bound Threshold? | Alert if the metric value is less than or equal to the threshold, instead of alerting if it is greater than or equal to the threshold. |
| Time Period (mins) | The time period over which the metric is calculated. |
| Minimum Transaction Count | Time periods with very few transactions have much less meaningful metrics, so this can be used to suppress alerts from being generated unless the time period has a minimum transaction count. Note This field will be displayed if Error Rate (%) is selected in the Metric field. |
| Severity |
|
| Email Notification | Comma separated list of email addresses. |
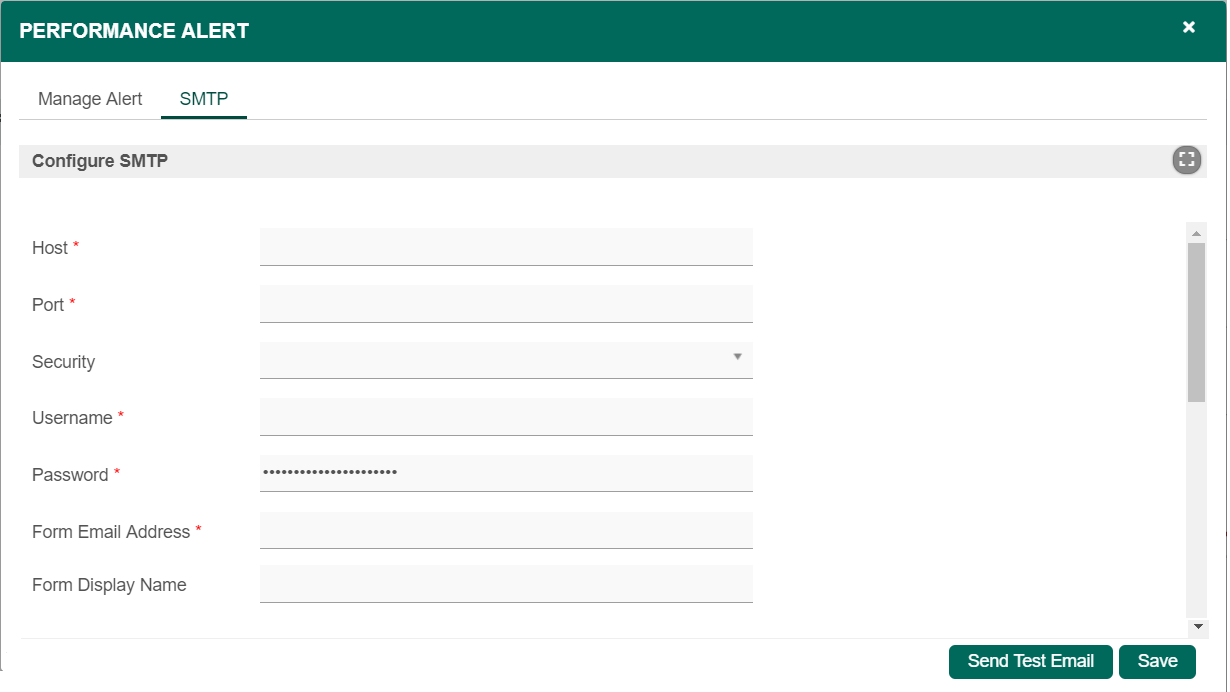
Figure 12 : Performance Alert - SMTP Settings
If no SMTP settings is configured here, this tool will read the SMTP configuration in the "General Settings".
You may configure common SMTP settings in "General Settings > SMTP Settings" for your future convenience.
| Name | Description |
|---|---|
| Host | Email Server SMTP Host Example |
| Port | Email Server SMTP Port Typically, port 465 for SSL security option and 587 for TLS |
| Security |
|
| Username | Email Server Account Username On Google email account, use your full email address. |
| Password | Email Server Account Password Password submitted will be encrypted for security reason. |
| From Email Address | sender email address |
| From Display Name | sender display name Example Info No Reply |
Quick Test
Hit on the "Send Test Email" button to quickly validate and test out your email settings.